Overview
Queensland’s health sector entities work together to provide accessible healthcare for the state and support the wellbeing of people in their communities. They do this while facing rising costs, growing demand for services, and workforce pressures.
Tabled 15 January 2025.

Report on a page
This report summarises the audit results of Queensland Health entities, which include the Department of Health and 16 hospital and health services (HHSs). It also summarises the audit results for 13 hospital foundations, 4 other statutory bodies, and 2 entities controlled by other health entities.
Queensland Health accounts for approximately 30 per cent of the amount the state government spends annually on operating expenses for government departments. As such, increases in health expenditure have a direct impact on the state’s financial position.
Financial statements are reliable, but controls over information systems need to be strengthened
We found the health sector entities’ financial statements to be reliable, and their systems and processes (internal controls) strong, except for those relating to information systems. The weaknesses we found in these controls are of particular concern, as health entities are attractive targets for ransomware and similar cyber attacks.
The amount of payroll overpayments the department needs to recover from staff has increased since last year. Because of delays in starting repayment plans, recovery of these overpayments may be difficult.
Entities face challenges in managing the cost of services
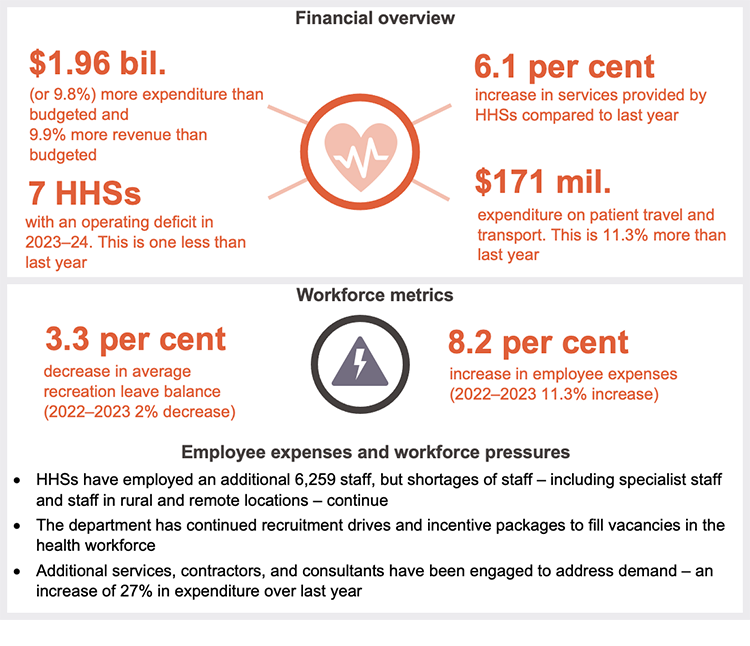
This year, HHS expenditure was 9.8 per cent higher than budgeted (2022–23: 9.9 per cent higher than budgeted). This was because the HHSs provided more services (6.1 per cent more than last year), employed 6,259 more staff, and experienced higher costs for medical clinical supplies, drugs, pathology and information and communication services.
The state government provided significant funding ($2.1 billion) to the department for building and upgrading health facilities, including satellite hospitals (which in some cases have taken pressure off emergency departments in major hospitals). The cost of maintenance that should have been performed on HHS assets grew by $580 million this year and is now over $2 billion. While inconsistencies in the HHSs’ reporting creates uncertainty about the accuracy of this figure, the high level of deferred maintenance means it is likely the condition of health facilities is worsening.
Addressing demand for health services
This year, more people presented at Queensland emergency departments, and demand for ambulance services continued to grow. HHS performance has declined against key performance indicators for emergency departments. This also affected ambulance performance. The decline was consistent with that of other Australian states and territories.
Queensland Health has not met its seen-within time-related targets relating to outpatient appointments for specialists. Its results against the 2 most time-critical categories were the worst in 9 years. This is despite more outpatients being treated than ever before. On a positive note, the number of patients who experienced what is referred to as a ‘long wait’ fell in 2023–24.
This year, we also looked at how Queensland compares to other states and territories in relation to minimising potentially preventable hospitalisations. National data shows that Queensland has been ranked seventh out of the 8 states and territories. In August 2024, we recommended that the department define its strategic objectives for reducing potentially preventable hospitalisations and develop performance indicators and targets. The department accepted our recommendation and plans to implement it in a 2-phase approach by 30 June 2026.

1. Recommendations
We have identified the following recommendations for the Department of Health and the hospital and health services (HHSs) relating to asset maintenance.
| Managing assets to ensure maintenance is performed when required |
|---|
We recommend: 1. the Department of Health updates its ‘Asset Management Key Terms paper’ to clearly define key asset maintenance terms 2. the Department of Health and HHSs report the values against each of these terms in their annual reports
|
Health entities need to take further action on prior year recommendations
This year, we identified deficiencies in the entities' systems and processes (internal controls) related to information security, asset management, rostering and overtime, and procurement.
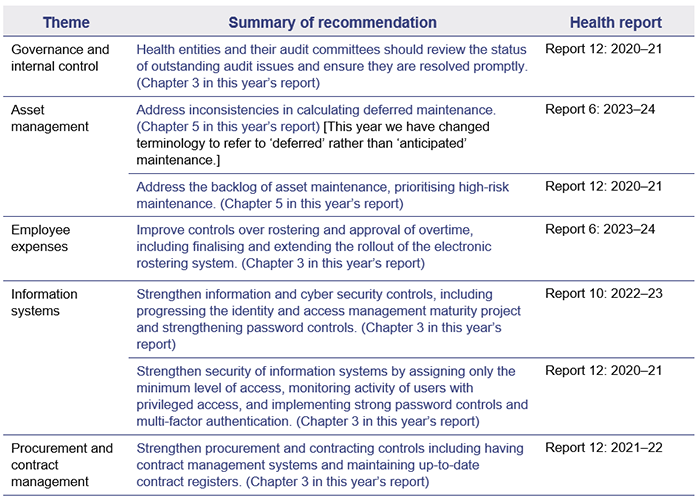
We have identified many of these issues in prior year reports, in some cases going back at least 4 years, as shown in the following table.
We have included a full list of prior year recommendations and their status in Appendix E.
Reference to comments
In accordance with s.64 of the Auditor-General Act 2009, we provided a copy of this report to relevant entities. In reaching our conclusions, we considered their views and represented them to the extent we deemed relevant and warranted. Any formal responses from the entities are at Appendix A.

2. Entities in this report
This report summarises the financial audit results for health sector entities.
The Department of Health (the department) is responsible for the overall management of Queensland’s public health system. The department works with hospital and health services, which are independent statutory bodies, to deliver health services. It contracts with each hospital and health service’s board through annual service agreements, which establish the health services the department is buying, and the funding that will be provided to each board for delivery of those services.
Figure 2A outlines the main entities and the relationships between them. Appendix F provides a complete list of the health sector entities for which we have issued an audit opinion.
Note: * Mater Misericordiae Health Service Brisbane also provides public health services under a service agreement with the Department of Health.
Queensland Audit Office.

3. Results of our audits
This chapter provides an overview of our audit opinions for entities in the health sector. It also provides conclusions on the effectiveness of the systems and processes (internal controls) the entities use to prepare financial statements.
Chapter snapshot
Audit opinion results
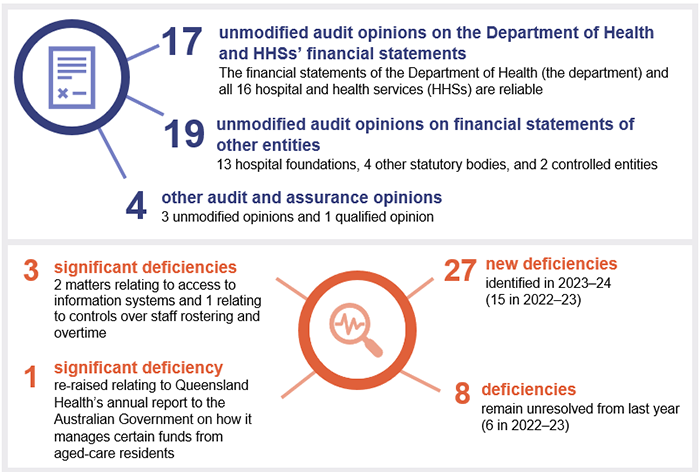
We issued unmodified audit opinions for all health sector entities in Queensland, including the department, the 16 hospital and health services (HHSs), the 13 hospital foundations, 4 other statutory bodies, and 2 controlled entities. This means that their financial statements can be relied upon. We issued an unmodified audit opinion with an emphasis of matter for 2 controlled entities.
All entities reported their results within their legislative deadlines. Appendix F provides detail about the audit opinions we issued for 36 entities in 2024.
We express an unmodified opinion when financial statements are prepared in accordance with the relevant legislative requirements and Australian accounting standards.
We qualify our opinion when the financial statements as a whole comply with relevant accounting standards and legislative requirements, with the exceptions noted in the opinion.
Significant deficiencies are those of higher risk that require immediate action by management.
Deficiencies are of lower risk and can be corrected over time.
We include an emphasis of matter to highlight an issue of which the auditor believes the users of the financial statements need to be aware. The inclusion of an emphasis of matter paragraph does not change the audit opinion.
Entities tabled their annual reports by the legislative deadline, and were more timely
The timely publication of annual reports, which include audited financial statements, enables parliament and the public to assess the financial performance of public sector entities while the information is still current.
The department, the HHSs, hospital foundations, and other health statutory bodies all tabled their annual reports prior to the legislative deadline of 30 September 2024 as follows:
- the department, 16 HHSs, and 7 hospital foundations tabled on 19 September
- 6 hospital foundations tabled on 20 September
- one statutory body tabled on 23 September
- 3 statutory bodies tabled on 24 September.
This is an improvement from 2023, when these entities tabled their reports from 27 to 29 September. The earlier tabling this year was driven in part by the state election on 26 October 2024.
Other audit certifications
We issued a qualified audit opinion for the annual prudential compliance statement for Queensland Health’s aged-care facilities. In this statement, Queensland Health is required to outline to the Australian Government how it has managed refundable accommodation deposits, accommodation bonds, and entry contributions from aged-care residents.
We qualified our audit opinion because of 2 non-compliance issues with the Aged Care Act 1997 (the Act). We identified instances where entities had not complied with the requirement to enter into accommodation agreements within 28 days of a person’s entry to an aged-care facility. We also identified instances where refunds of refundable accommodation deposits (following the death of a resident) were not supported by the documents required under the Act. We have qualified our opinion each year since 2017–18.
Appendix G lists the other audit and assurance opinions we issued.
Entities not preparing financial statements
Not all entities in the health sector produce financial statements. Appendix H lists the entities not preparing financial statements along with the reasons why.
Internal controls are generally effective but some need to improve
Section snapshot 3.1
We assess whether the systems and processes (internal controls) entities use to prepare financial statements are reliable. We report any deficiencies in the design or operation of those internal controls to management for their action. The deficiencies are rated as either significant deficiencies (those of higher risk that require immediate action by management) or deficiencies (those of lower risk that can be corrected over time).
Overall, to the extent that we tested them, we found the internal controls that health sector entities have in place to ensure reliable financial reporting are generally effective, but they can be improved.
While we were able to rely on the internal controls for the purposes of our audits, we identified deficiencies in information systems controls at the Department of Health.
These deficiencies indicate a need to strengthen controls to manage cyber security risks and prevent inappropriate access to the information the entities hold.
This year, we have reported 4 significant deficiencies (one new, 2 that remain unresolved from prior years, and one unresolved significant deficiency that we previously reported as a deficiency) and 35 deficiencies (27 new and 8 that remain unresolved from prior years).
The significant deficiencies relate to:
- control of access to information systems at the department (2 matters reported)
- our qualified audit opinion of the aged-care annual prudential compliance statement
- ineffective controls over staff overtime payments at one HHS.
Areas for improvement for health sector entities
Information systems controls and cyber security
The Annual Cyber Threat Report 2023–24 from the Australian Cyber Security Centre identified health as one of the 5 sectors most vulnerable to cyber security incidents. Due to the nature of the personal information health entities hold, they are valuable targets for cyber criminals.
Successful cyber attacks can occur because of weaknesses in an entity’s information technology control environment. All entities should continually assess their cyber risk vulnerabilities and act on any gaps they identify.
Queensland Audit Office.
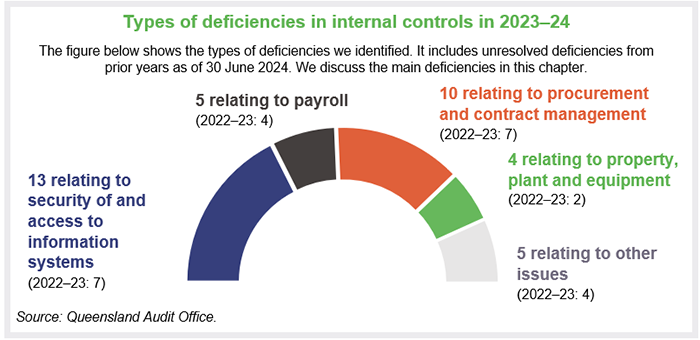
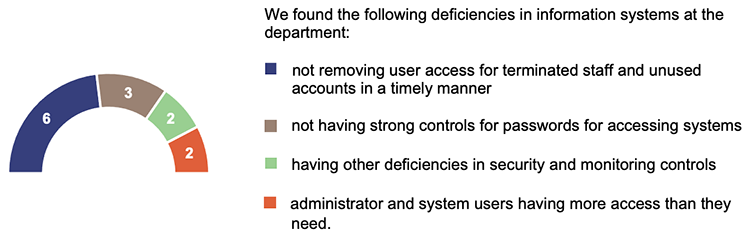
We identified 13 control deficiencies related to information systems this year, compared to 7 last year (5 of which have been resolved. The remaining 2 are in progress). This increase is partly because we looked at more systems this year, in response to the growing cyber risk.
It is critical that the department addresses the weaknesses in its information systems controls. In addition to its own systems, it is responsible for supporting the information technology needs of the 16 HHSs. The impact of a successful cyber attack on the hospitals could be major and wide ranging.
Entities need to apply the appropriate security principles and recommendations to all systems they use, so they are all properly secured.
Health entities should act on all relevant recommendations in Responding to and recovering from cyber attacks (Report 12: 2023–24). Also, in State entities 2023 (Report 11: 2023–24), we included a recommendation for all entities to manage the cyber security risks associated with services provided by third parties, that is, other organisations with access to health networks and data. We will follow up on the status of recommendations from these reports in our future audits.
We intend to perform a performance audit on managing third-party cyber security risks in 2025–26, as identified in our Forward work plan 2024–27. We will examine how effectively the Queensland Government identifies third parties with access to its data and networks, assesses related security vulnerabilities, establishes relevant controls, and minimises the impact of security breaches through these third parties.
Payroll overpayments
The department’s financial statements report outstanding payroll overpayments of $67.6 million – up from $49.8 million as of 30 June 2023. This is an increase of $17.8 million, or 36 per cent.
In addition, payroll overpayments of $3.2 million were written off during the year. There would have been an even higher amount of outstanding payroll overpayments in this year’s financial statements if this had not occurred.
We have previously reported on the complexity of the health payroll system, noting that there are multiple employment awards in operation and complex award structures and allowances. The challenge of ensuring accurate payroll payments is increased by the large number of staff.
There are approximately 110,000 full-time equivalent employees across the department and HHSs. Direct health service and frontline medical employees, which account for more than 80 per cent of the health sector’s staff, work across Queensland on a 24-hour roster. This means many adjustments must be made to standard pays because of overtime and penalty payments and late changes to shifts.
The department continues to closely monitor and report on trends in payroll overpayments, including reasons for overpayments, and actions taken to recover them. Its reporting shows that the average value of overpayments each fortnight in 2023–24 was $1.2 million (approximately 0.22 per cent of gross pay each period). This is a slight improvement over the previous year. The department estimates that 75 per cent of payroll overpayments are due to late (manually completed) forms, and it is working on strategies to address this, as noted below.
The department stopped its automated recovery of payroll overpayments during 2022–23 to ensure compliance with the Industrial Relations Act 2016. The Act allows employers to recover overpayments related to absences from work, but other types of overpayments require an employee’s consent to recover. The ceasing of automated recovery of overpayments, and the resulting need to obtain employee consent to enter repayment plans, has contributed to the growth in the total outstanding balance.
Integrated Workforce Management system
The department is introducing an electronic rostering system – the Integrated Workforce Management (IWFM). It will remove the need for forms to be completed manually and will make roster-to-pay processes simpler.
The IWFM is currently being used for nursing and midwifery staff (approximately 38 per cent of the HHS workforce) in 10 HHSs. The department plans to implement it in a staged approach across the remaining 6 in late 2024–early 2025. It is also planning to apply the IWFM to other occupational groups.
This is in line with a recommendation we made in our Health 2023 (Report 6: 2023–24) report.
Payroll – rostering and overtime
In last year’s report, we identified a significant deficiency at an HHS that had ineffective controls over the approval of unplanned overtime. We also reported deficiencies at 4 other HHSs relating to the approval of rosters and overtime. The respective HHSs are working on the issues we identified; but they had not resolved them by the time we completed our 2023–24 audits.
This year, we identified instances of ineffective controls over the approval of rosters at another HHS, which means there are now 5 HHSs that have issues with ineffective controls over this.
The department and 16 HHSs should continue to strengthen overtime and payroll controls and implement our recommendations. We acknowledge that the IWFM program will help address some of the issues we have identified.
Procurement and expenses – contracts
The department and HHSs have worked to resolve several procurement control deficiencies we have reported on since 2017–18, but we continue to identify new weaknesses in their processes. There are currently 10 outstanding deficiencies relating to procurement controls. We identified 6 of these last year.
The nature of procurement issues that we reported this year include:
- non-compliance with the Queensland Government procurement guideline, which requires entities to publish details of significant contracts they have awarded
- use of corporate cards in a way that is inconsistent with the corporate card policy, including a purchase for a value higher than allowed under the policy
- a lack of enforcement of the terms of a contract
- a lack of evidence to confirm that the individual who verified the delivery of physical goods against a purchase order was not the same as the person entering the received goods into the system.
Property, plant and equipment
We also continue to identify deficiencies in property, plant and equipment processes at the HHSs. We raised 4 deficiencies this year.
They related to breakdowns in controls for:
- determining if the expenditure incurred should be treated as an expense or included as part of the asset’s value
- ensuring a timely transfer of work-in-progress costs into the relevant property, plant and equipment category once the asset is in use (at 2 HHSs)
- ensuring the accuracy of the remaining useful lives of buildings when undertaking revaluations (useful life is the number of years an entity expects to use an asset – not the maximum period possible for the asset to exist).

4. Financial performance and sustainability
This chapter analyses the financial performance, position, and sustainability of Queensland Health entities, which include the Department of Health (the department) and the 16 hospital and health services (HHSs). In our discussion of sustainability, we consider financial matters as well as emerging issues relevant to the sector.
Chapter snapshot
Operating results summary
We consider a range of factors in assessing financial performance and sustainability. The department and HHSs are not-for-profit entities. So, rather than focusing solely on whether they achieve a surplus or deficit, we place more emphasis on:
- the total cost of their services compared to the services they deliver
- their adherence to approved budgets.
HHSs exceeded their expense budgets by $1.95 billion or 9.8 per cent (2022–23: $1.8 billion or 9.9 per cent). The increased expenditure reflects the higher volume of services they delivered this year, increased employee costs, and the impact of inflation on the costs of goods and services. HHSs reported a 6.1 per cent increase in the health services they delivered (2022–23: 11 per cent increase).
HHSs received more funding, enabling them to deliver additional activity and offset the impact of inflation on costs. Revenue for the health sector was 9.9 per cent higher than budgeted (2022–23: 9.6 per cent higher).
Employee-related expenses were approximately $1 billion higher than budgeted (2022–23: $1.3 billion higher than budgeted), reflecting the increase in the number of employees, as well as the outcomes of new enterprise bargaining agreements.
In 2023–24, HHSs achieved a total operating result (the difference between income and expenses) of $8.8 million surplus (2022–23: $67.8 million deficit). This surplus represents 0.04 per cent of the $21.8 billion of income received by HHSs. (In 2022–23, the deficit represented 0.34 per cent of $19.8 billion of income.)
Pressure on hospital and health services’ operating budgets
The 2023–24 state budget expected each HHS and the department to break even during the year, with total income equalling total expenditure. However, the department and 7 HHSs reported an operating deficit. All of the HHSs with a deficit are in remote or rural areas of Queensland.
Many HHSs have reported that increased costs have affected their ability to remain within budget. To meet the demand for additional services, the number of employees has increased and a greater volume of goods and services have been purchased.
The 2024–25 state budget again has an expectation that the department and all HHSs will break even. To assist the department and HHSs in achieving this, the budget is providing an additional $1.8 billion in funding compared to last year’s budget.
Despite this, achieving a break-even result may be unrealistic, as cost increases are unlikely to ease. While this year’s budgeted funding is 11.7 per cent higher than the prior year budget, it is only 3.4 per cent higher than what the department and HHSs actually spent last year.
Analysis of health sector expenditure
Total expenditure incurred by HHSs increased by 9.9 per cent this year, from $19.8 billion to $21.8 billion. All HHSs incurred expenses higher than their budgeted amounts, with variances between 6.1 per cent and 13.3 per cent.
The drivers for increased expenditure this year included:
- the increased staff numbers required to address the growth in demand for healthcare services, resulting in higher employee-related expenses
- pay increases for staff, including cost-of-living adjustment and incentive payments in line with enterprise agreements and increased superannuation contributions
- outsourcing to private sector health providers to reduce waitlists
- use of external contractors to cover staff on leave and staff vacancies
- increased expenditure on supplies and services due to the increased level of activity delivered during the year
- price increases on certain supplies and services, particularly clinical supplies, drugs, insurance, pathology, and information technology and communication.
Workforce pressures, and analysis of employee expenses
Queensland Health’s Health Workforce Strategy for Queensland to 2032 includes projections for population growth, ageing, increased hospital activity, and the impact on its required workforce.
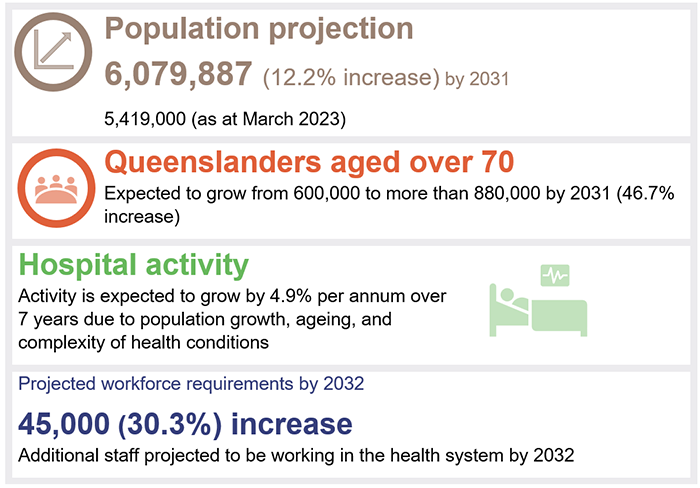
Queensland Audit Office from Queensland Health’s Health Workforce Strategy for Queensland to 2032.
Adding to the challenge of recruiting new staff is the need to replace staff who leave due to retirement and other reasons.
The department projects that within the next 10 years, 20 per cent of the existing workforce will reach retirement age. The health sector has experienced an increase in turnover since 2020, with higher turnover in rural and remote areas, where it is 9.5 per cent (4.5 per cent for metro areas).
To address workforce challenges, Queensland Health's Health Workforce Strategy for Queensland to 2032 identifies 3 priority focus areas:
- supporting and retaining the current workforce
- building and attracting new pipelines of talent
- adapting and innovating new ways to deliver.
As a measure of the success of the workforce strategy, the number of full-time equivalent employees working at the department and HHSs increased by approximately 7,596 during 2023–24 (6,259 increase in HHS employees and 1,337 increase in departmental employees). This is an increase of approximately 7.5 per cent.
Increase in employee expenses
In total, HHS employee expenses:
- increased from $13.6 billion in 2022–23 to $14.8 billion in 2023–24 – an increase of 8.2 per cent since last year
- were above the budgeted amount by 7.6 per cent (2022–23: 9 per cent).
The increase in total employee expenses this year is mainly attributable to the 7.1 per cent increase in the number of full-time equivalent staff working in the HHSs. Other contributing factors are:
- salary and wage increases driven by enterprise bargaining agreements, including cost-of-living adjustment payments
- associated flow-on increases to employee-related costs, such as annual and long service leave and employer superannuation contributions.
Leave balances remain high, but are decreasing
Recreation leave balances
Recreation leave balances have trended downwards and are at the lowest level in the last 3 years.
Overall, average recreation leave balances decreased by 3.3 per cent in 2023–24 compared to last year (2 per cent decrease in 2022–23).
As shown in Figure 4B, average recreation leave balances per employee have reduced for nearly all HHSs. This shows that HHSs are managing employees' leave and workforce pressures.
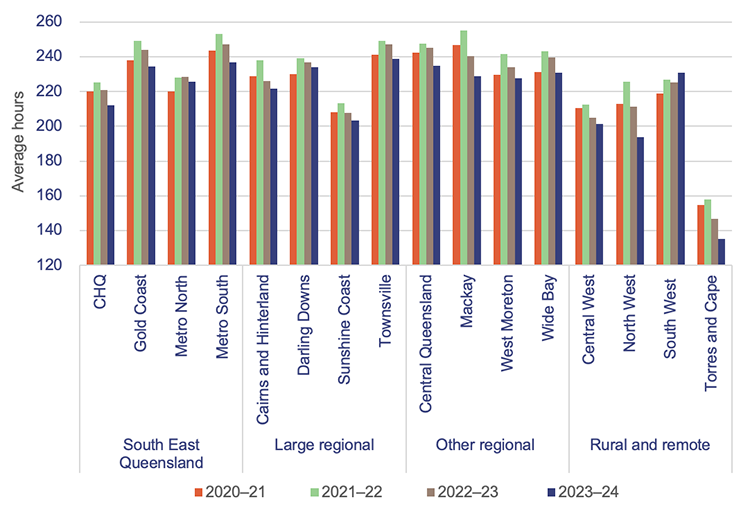
Note: We have included recreation leave balances for staff who were employed from 1 July to 30 June of each financial year. CHQ – Children’s Health Queensland.
Queensland Audit Office, from Department of Health data.
Sick leave and overtime expenses
Overall, there was an increase in both sick leave taken (3 per cent increase) and overtime worked (5 per cent increase) this year.
In 2021–22, sick leave and overtime increased due to COVID-19, particularly during large outbreaks (see the key observations below Figure 4C). These expenses decreased in 2022–23, but they have increased this year. This may be due to the 7.5 per cent increase in the number of full-time equivalent employees.
Figures 4C and 4D show sick leave hours and overtime paid over the last 4 years.
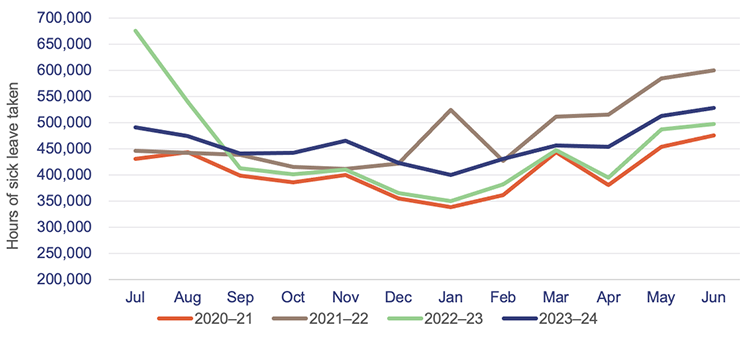
Queensland Audit Office, from Department of Health data.
| Key observations | |
▲ 3% increase in sick leave this year |
▲ 5% increase in overtime paid this year |
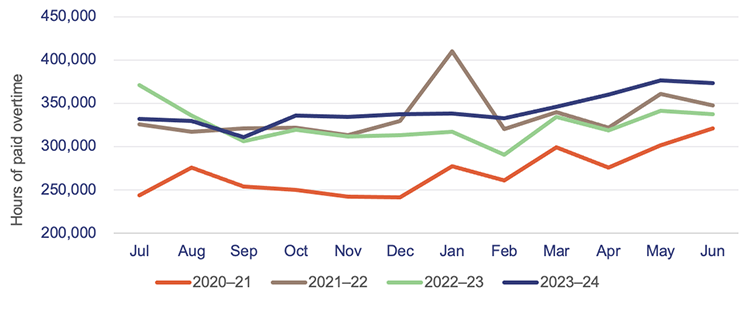
Queensland Audit Office, from Department of Health data.
Contracting additional staff
In 2023–24, Queensland Health recorded a 27 per cent increase in expenditure for frontline contractor staff (for example, nurses and other clinical contractors) – an increase of $92.8 million. This was due to an increase in demand, and it builds on the $47 million (16 per cent) increase in 2022–23.
Most of the increase in expenditure was incurred by the regional areas, where the costs of obtaining additional labour are higher.
Figure 4E shows expenditure on this across the HHS regions.
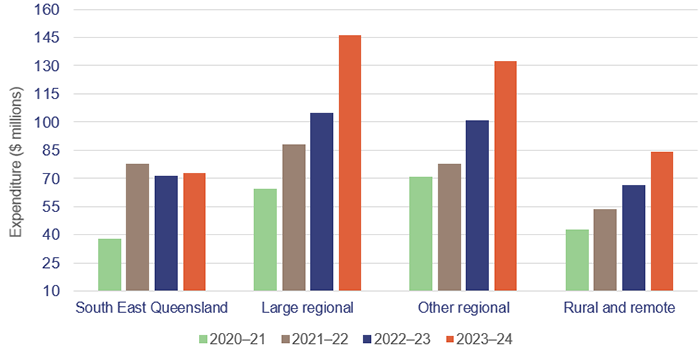
Queensland Audit Office, from Department of Health data.
Analysis of expenses for supplies and services
HHS expenditure on supplies and services was $5.6 billion this year, an increase of 14.5 per cent ($710 million) over last year. Two of the main contributors to this are a 24 per cent ($98 million) increase in consultants and contractors (both clinical and non-clinical), and a 13 per cent ($191 million) increase in clinical supplies and clinical and non-clinical services, including outsourced service delivery.
HHSs delivered 6.1 per cent more activity in 2023–24, requiring more clinical supplies and services. There has been a general trend across the HHSs of costs increasing by an average of 11.5 per cent this year (8 per cent last year) for medical consumables, pathology, and prosthetics.
HHSs also experienced cost increases on expenditure in other areas of supplies and services. For example, communication expenses increased by 35 per cent ($66.3 million), repairs and maintenance increased by 17 per cent ($56 million), and computer services increased by 32 per cent ($55.8 million).
These increases are higher than the general cost movements noted in the consumer price index, which increased by 3.8 per cent from June 2023 to June 2024.
Patient travel expenses were higher this year and additional funding was provided for the Patient Travel Subsidy Scheme
HHSs spent $171 million in 2023–24 on patient travel and transport. This was an increase of 11.2 per cent over patient travel and transport expenses of $154 million in the prior year. Approximately 92 per cent of the total expenditure was by HHSs outside the South East Queensland region.
HHSs receive funding from the department to assist with patient travel and transport expenses, including specific funding for the Patient Travel Subsidy Scheme (PTSS) and for aeromedical retrieval.
The PTSS assists eligible patients with their commercial travel and accommodation to attend medical appointments and specialist treatment that is not available locally. By assisting with the travel-related financial burdens, the scheme helps patients avoid delays in accessing treatment, reducing the risk of more acute conditions that lead to higher healthcare costs in the long term.
Effective from 1 July 2023, PTSS rates were increased, with accommodation subsidies rising from $60 to $70 per night and mileage rates increasing from 30 cents to 34 cents per kilometre. The financial assistance is provided to eligible patients who need to travel more than 50 kilometres to access specialist medical services.
The PTSS assists patients with their travel costs but is not designed or intended to fund the full cost of all forms of patient travel. While HSSs may redirect additional financial support to patients from other funding sources, this is based on patient outcomes that need to be achieved in each HHS (for example, where there is a higher burden of disease in an area), and the extent of service delivery gaps for HHSs in regional and remote areas of the state.
Analysis of the health sector’s income
This year, the actual income of the HHSs combined was 9.9 per cent above budget (2022–23: 9.9 per cent increase). The income of all HHSs individually was higher than projected in the state budget.
Types of funding for HHSs The 4 main funding sources for HHSs are:
The main types of government funding for HHSs are:
|
Hospital and health services delivered more activity than the prior year
Service agreements are negotiated between the department and each HHS. The agreements outline the services the department purchases from each HHS, the volume, and the amount it pays for those services. The HHSs receive ABF and/or block funding (for services beyond the scope of ABF). Of the 16 Queensland HHSs, 15 are funded partially by ABF. The Central West HHS receives block and other funding rather than ABF. This is because it operates smaller public hospitals where the technical requirements for applying ABF are difficult to apply.
Under the service agreements, the department and HHSs measure service activity using Queensland Weighted Activity Units (QWAUs), which tie into ABF.
Figure 4F shows that activity increased by 6.1 per cent this year to 2,659,070 QWAUs (2022–23: 2,506,096 QWAUs). This was within 2 per cent of the total volume of activity the Department of Health agreed with HHSs for 2023–24.
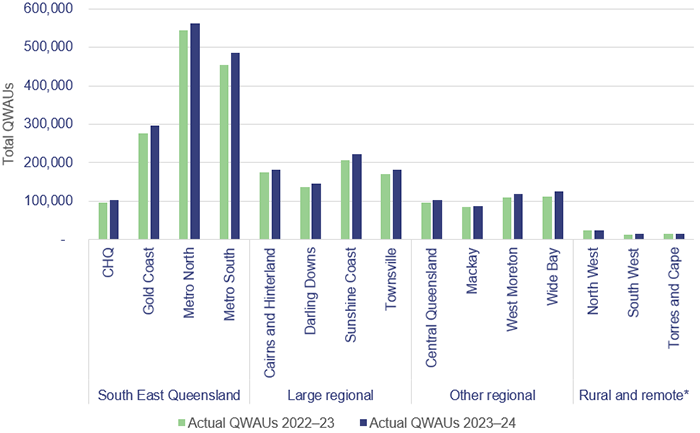
Note: * Central West HHS did not report on activity in 2022–23 and 2023–24. CHQ – Children’s Health Queensland.
Queensland Audit Office, from hospital and health service annual reports 2022–23 and 2023–24.
The state and federal governments are continuing to invest in mental health services
The 16 HHSs, through the department, receive specific funding for the provision of mental health services. Funding provided by the state and federal governments can be based on ABF or block funding. Mental health services provided to patients who are admitted to hospital are based on activity, whereas those for patients who are not admitted receive block funding.
Funding increased in 2023–24 to meet the rising demand for mental health services, as shown in Figure 4G.

Queensland Audit Office, from Department of Health data.
As noted in our Forward work plan 2024–27, the Queensland Audit Office will be conducting a performance audit to assess how well Queensland’s state-funded mental health services are meeting the needs of Queenslanders.
It will also consider key recommendations made in 2022 by the Mental Health Select Committee, and the government’s progress in implementing them. The audit is scheduled for 2025–26.

5. Asset management in health entities
Health entities need to effectively manage their assets so they can deliver high quality and efficient health care services. They need to plan for future requirements (by considering factors such as service demand, ageing population, and population growth); manage existing assets; and invest in new assets.
To achieve outcomes that balance value for money with optimal health results, health entities and the Health Infrastructure Queensland (a division of the Department of Health), need to closely integrate how they manage and maintain their existing assets and construct new ones.
The impact of population growth and ageing on the need for hospitals and other assets
Population growth
Queensland has 20.5 per cent of Australia’s total population. The state’s population has been growing steadily, and in 2024, it had the third highest growth of any state or territory, with an increase of 2.5 per cent growth or 134,600 people (2023: 2.3 per cent growth).
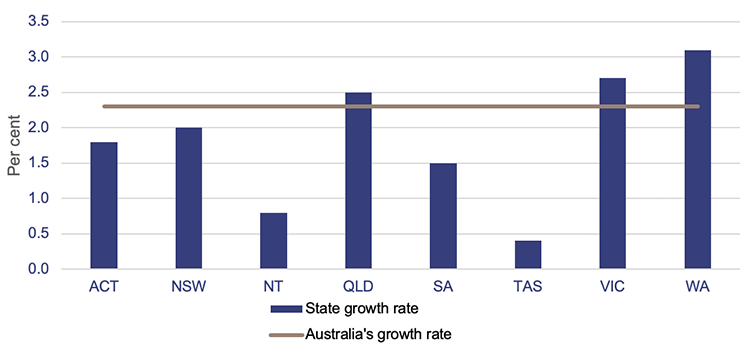
Note: ACT – Australian Capital Territory; NSW – New South Wales; NT – Northern Territory; QLD – Queensland; SA – South Australia; TAS – Tasmania; VIC – Victoria; WA – Western Australia.
Population estimates: States and territories – Queensland Government Statistician’s Office.
Ageing population
Consistent with other Australian states and territories, and many other countries around the world, Queensland has an ageing population. As per the 2021 census, the number of Queenslanders aged 65 years and older grew by 54 per cent from 2011 to 2021.
In 2021, 17 per cent (875,600 individuals) of the population was aged 65 years and older, and projections indicate that this number could exceed 1.3 million by 2036 (a 49 per cent increase in a 10-year period).
This, together with the overall growth in population, will place more pressure on the healthcare system and the services it needs to deliver.
Meeting health infrastructure challenges
The health sector has to build infrastructure to meet the demands of the growing and ageing population. It also needs to plan to replace its existing and ageing infrastructure.
As shown in Figure 5B, approximately 37.4 per cent ($8.7 billion) of buildings currently owned by the Department of Health (the department) and the 16 hospital and health services (HHSs) are due to be replaced within the next 10 years. This is based on their recorded remaining useful lives (32 per cent or $7.5 billion in 2022–23). (Useful life is the number of years an entity expects to use an asset – not the maximum period possible for the asset to exist.)
Closing gross replacement cost is the estimated cost to construct a similar asset without adjustments for age and condition of the existing asset as of 30 June each year.
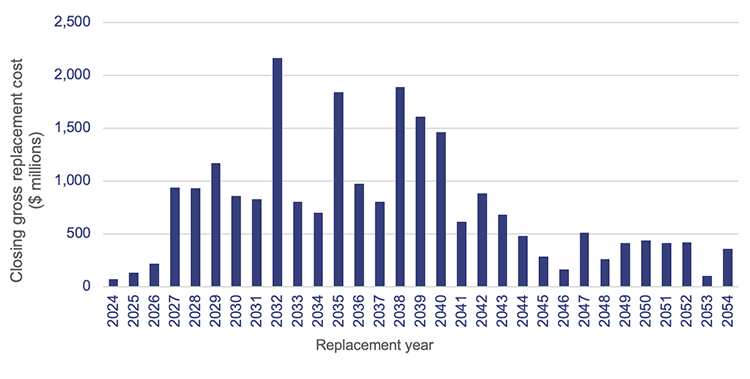
Queensland Audit Office, from Department of Health and hospital and health service asset registers 2024.
The department anticipates that buildings will last longer than their recorded remaining useful lives indicate because of planned refurbishments, redevelopments, and various capital maintenance projects that will prolong their useful lives (subject to suitable funding being provided). This also depends on HHSs funding repairs and maintenance activities to prevent premature deterioration of existing assets.
A large portion of buildings in the regional, rural, and remote HHSs are aged between 10 and 50 years. Several HHSs, such as Cairns and Hinterland HHS and the Darling Downs HHS, have a larger portion aged over 50 years.
Capital budget for the health sector
The 2024–25 capital (major project) budget identifies significant investments that will be made in the health sector over the next 5 years to address the pressure on ageing infrastructure caused by growing demand for healthcare services. The most significant programs outlined in the 2024–25 budget include:
- $1.2 billion for the Capacity Expansion Program (originally announced in the 2022–23 capital budget), which includes new hospitals in Bundaberg, Toowoomba, and Coomera; the new Queensland Cancer Centre (in Brisbane); and major hospital expansions across 11 sites across Queensland. This program is expected to deliver an additional 2,200 beds across the state.
- $215 million for the Sustaining Capital Program (originally announced in the 2021–22 capital budget) aimed at
- improving ageing rural and regional healthcare facilities and staff housing as part of the next stage of the Queensland Health Building Rural and Remote Health Program (originally announced in the 2021–22 capital budget)
- funding a range of minor capital projects. This investment seeks to refurbish and upgrade Queensland's health infrastructure to ensure that facilities and equipment meet current operational standards
- funding the Accelerated Infrastructure Delivery Program, with ongoing delivery of the expansion of the Ripley Sub-Acute and the Gold Coast University Hospital Sub-Acute facilities (originally announced in the 2022–23 capital budget).
In 2023–24, the budgeted expenditure target was $1.6 billion. The health sector actually spent $2.1 billion – 30 per cent over the budgeted target. As shown in Figure 5C, it has delivered several infrastructure projects across the state.
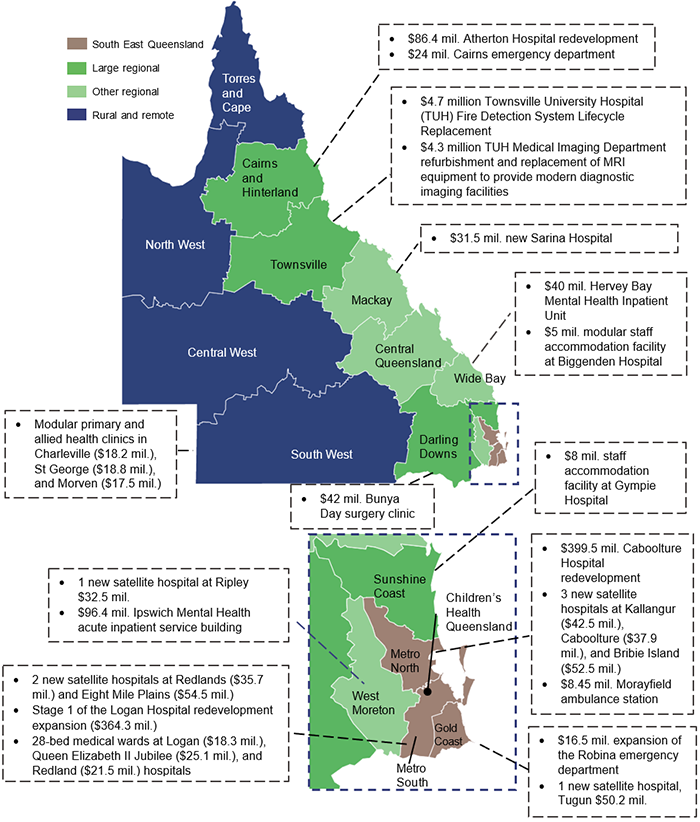
Note: We have only included those completed projects above $4 million.
Queensland Audit Office, from the hospital and health services’ annual reports and Department of Health records.
Current market conditions are placing significant pressure on costs, while shortages of materials and labour are causing delays in the anticipated schedule for the projects.
Over the next 8 years, this pressure will intensify, as a substantial number of capital projects are implemented throughout Queensland. For example, there will be competing demands for resources for infrastructure for the Olympic and Paralympic Games, as well as for transport, energy, and water initiatives.
We will be reporting on these competing infrastructure projects in our Major projects 2024 report, which is expected to be tabled in parliament by January 2025.
Reporting on maintenance needs of assets
HHSs reported a 40 per cent increase in the maintenance needs of their assets, which indicates they continue to face significant challenges in funding the maintenance of their assets. This includes operational maintenance that has been deferred, capital maintenance that has been deferred and, in some cases, forecast future asset renewals, replacements, and refurbishments.
Deferred maintenance (which comes from operational expenditure – OPEX) is defined as maintenance that has not yet been carried out but is necessary to prevent the deterioration of an asset or its function.
Capital maintenance (CAPEX) is defined in the department’s draft Asset Management Key Terms paper as capital works that are required to bring the condition of building assets to a required standard to meet service delivery needs. This is maintenance of a capital nature that should have been done by now, but has not been performed because it has not been funded.
The distinction between capital expenditure (CAPEX) and operational expenditure (OPEX) lies in their purposes and impacts on assets. Capex involves investments that either extend the lifespan of an asset or replace significant components of it, such as major parts of machinery or infrastructure. In contrast, OPEX refers to the ongoing costs required for the day-to-day functioning and maintenance of assets, so they remain in good operating condition.
The department uses the term ‘anticipated maintenance’ along with ‘capital maintenance’ and ‘deferred maintenance’.
Source: Department of Health draft Asset Management Key Terms paper.
Inconsistent terminology about deferred maintenance
In their 2023–24 annual reports, the department and the HHSs use inconsistent language to describe their maintenance needs. Out of 16 HHSs, 9 refer to ‘deferred maintenance’ and 7 refer to ‘anticipated maintenance’. Anticipated maintenance is a term that is not commonly used across government, nor is it defined in the Queensland Government Building Policy Framework – Growth and Renewal. This term is unique to Queensland Health.
Two HHSs have used annual report headings that refer to deferred maintenance, however their annual reports then go on to explain anticipated maintenance rather than deferred maintenance. The inconsistency in the HHSs’ annual reports indicates that there is confusion around the meaning of these terms.
In our discussions with the department, it stressed the importance of monitoring both deferred maintenance and capital maintenance which has been postponed over time. Both require budgeting/funding requirements and affect the longevity of existing assets.
Growth in maintenance needs
Figure 5D shows the growth in the amounts reported for maintenance needs over the last 5 financial years for each HHS region.
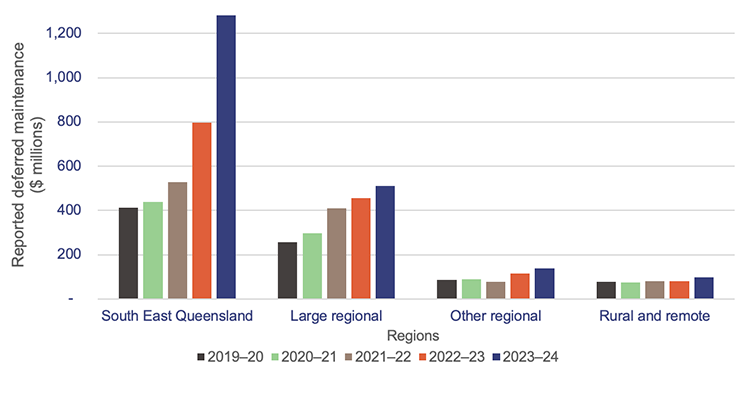
Queensland Audit Office, from the hospital and health services’ annual reports.
The cost of required maintenance across the HHSs as of 30 June 2024 was $2 billion – an increase of $580 million (40 per cent) from 2023. This has mainly been driven by an increase of $330 million in one HHS in the South East Queensland region.
The department has reviewed the required maintenance reported by HHSs and identified that the significant increase seen across the HHSs is due to 3 main factors:
- stricter evaluations of asset conditions, leading to the identification of additional maintenance needs that were already present at the South East Queensland HHS mentioned above
- HHSs including some items that do not match the department’s definition of ‘anticipated maintenance’, possibly inflating the increase (for example, forecast future life cycle renewals, replacements, and refurbishments)
- increased cost of undertaking maintenance – current market conditions, including shortages of materials and labour, are placing significant pressure on costs, and causing difficulties in accurately forecasting costs.
However, it remains unclear, to both the department and the Queensland Audit Office, to what extent these factors have driven the increase.
Nonetheless, the growing maintenance requirements across the sector suggest that additional funding is needed. Since HHSs must fund all operational maintenance from their own revenues, future budgets should include these operational costs. This is to ensure the entities can maintain these assets, so they can be used to deliver services effectively and efficiently.
Prioritising high-risk maintenance
In our Health 2020 (Report 12: 2020–21) report, we recommended that Queensland health entities continue to prioritise high-risk maintenance. HHSs assess the risk of any deferred maintenance to ensure their facilities are safe, and to identify any potential impact on users and services. If the deferred maintenance is identified as being of very high risk (for example, something that will result in having to close the wards or theatres, or that will affect service delivery), but can be repaired, work must be undertaken immediately and prioritised as part of the current financial year’s maintenance budget.
If deferred maintenance is identified as being of very high risk but is assessed as not being able to be repaired, the assets are flagged for replacement, and funding is prioritised through a statewide prioritisation process managed by the department.
HHSs identified several reasons for maintenance to be deferred:
- lack of funding (as well as increases in costs exceeding increases in funding)
- difficulty finding tradespeople, particularly in rural areas
- ageing buildings reaching a point where maintenance needs exceed resourced capacity and funding
- lack of strategic planning
- difficulty accessing clinical areas for works to be carried out, for example maintenance requires shutting down of wards
- lack of functionality in asset information systems to support effective asset management.
Further action is required by some HHSs to ensure that deferred maintenance, including high and very high-risk maintenance is correctly identified, reported, and appropriately managed.
Insight As reported in the QAO blog, ‘How do you maintain your buildings when funding and labour supply is limited?’, the department and the HHSs need to prioritise assets based on the impact on service delivery and risk of failure. By focusing on the assets that are essential to service delivery and are at risk of failure, entities can allocate their limited resources to where they matter most. Knowing the condition of their assets, and the risk and consequences of failure, will help them prioritise assets for maintenance. |
Inconsistent approaches to determining maintenance needs
The department and HHSs are required to adhere to the Queensland Government Building Policy Framework – Growth and Renewal, and report on deferred maintenance annually. However, the department and HHSs also refer to anticipated maintenance, which is not well defined. As reported in our Health 2023 (Report 6: 2023–24) report, there is currently no uniform standard that all health entities apply to determine their anticipated maintenance. This means there is a risk that the reported figures are not developed on a consistent basis and are not accurate.
Examples of their differing approaches include:
- using a deferred maintenance template that uses data from Queensland Health’s finance system
- using an internally developed model or software
- arranging for preparation by external consultants.
In response to a recommendation we made in Health 2023 (Report 6: 2023–24), the department is currently updating its asset management policy and is developing a paper on key asset management terms, which it expects to roll out to all HHSs for 2024–25. This is an opportunity for the department to clarify, for all HHSs, a consistent definition for deferred maintenance, postponed capital maintenance, and life cycle replacements, renewals, and refurbishments.
Recommendations for the Department of Health and HHSs Consistency in defining and reporting asset maintenance terms We recommend: 1. the Department of Health updates its ‘Asset Management Key Terms paper’ to clearly define key asset maintenance terms 2. the Department of Health and HHSs report the values against each of these terms in their annual reports
|
Maintenance targets
Every 3 years, the HHSs assess the condition of the assets they are currently using to provide their services. All HHSs report that the underlying data for the deferred maintenance generally comes from these condition assessments.
The assessments are prepared by a combination of internal staff and external consultants. Other sources of information may include field service reports, valuations, and maintenance expenditure targets agreed between the department and HHSs.
Maintenance expenditure targets can vary. The Queensland Government Building Policy Framework – Growth and Renewal recommends that a minimum funding target of one per cent of building replacement value be allocated for maintenance.
Queensland Health has determined that it needs 2.81 per cent of asset replacement value to achieve the expected life cycles of the assets. This 2.81 per cent target was developed to represent the cost measure of the total Queensland health portfolio over a long-term period. This maintenance expenditure target is made up of:
- a 1.56 per cent capital maintenance component, which is funded by the department following planning and applications by HHSs. This does not include building replacement or major refurbishments
- a 1.25 per cent repairs and maintenance component, which is funded by the HHSs.
Actual expenditure on repairs and maintenance
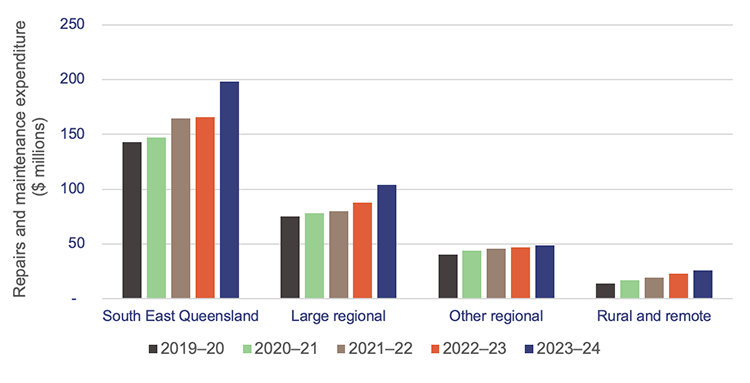
Figure 5E shows the actual expenditure on maintenance and repairs for each HHS region for each year between 2019–20 and 2023–24. Most HHSs increased their repairs and maintenance expenditure in 2023–24, with an overall increase of 17.5 per cent (2022–23: a 3.4 per cent increase).
This increase has been driven by:
- increased maintenance activities being undertaken by HHSs due to year-on-year compounding issues with ageing infrastructure. (Limited funding for asset replacement has led to higher spending on ongoing repairs and maintenance, which has become more necessary year after year.)
- increases in costs due to supply chain issues
- cost increases in construction materials
- labour supply shortages.
Queensland Audit Office, from Department of Health data.
Between the 2022–23 and 2023–24 financial years, there has been a notable difference in the growth rates of actual repairs and maintenance and that of deferred maintenance (as reported in HHS annual reports, which may include deferred maintenance, capital maintenance that has been postponed, and in some cases life cycle renewals, replacements, and refurbishments):
- In 2022–23, actual repairs and maintenance grew by only 3.4 per cent, while deferred maintenance increased by 32 per cent.
- In 2023–24, actual repairs and maintenance increased by 17.5 per cent, while deferred maintenance increased by 37 per cent.
This suggests that HHSs are making progress in narrowing the gap between actual repairs and maintenance and deferred maintenance.
Actual maintenance carried out
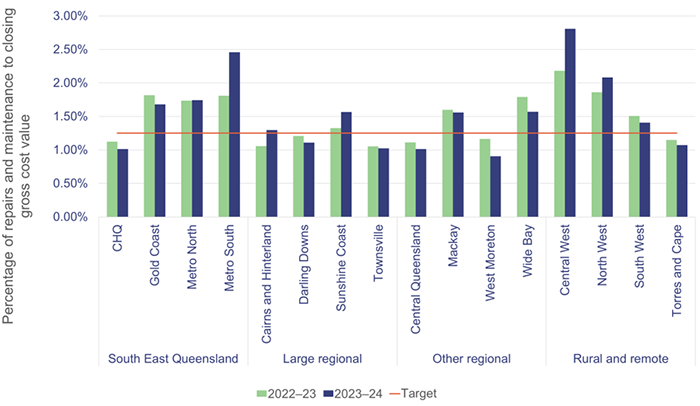
Figure 5F shows repairs and maintenance expenditure as a percentage of the gross replacement cost of buildings per HHS, compared to the 1.25 per cent repairs and maintenance target set by Queensland Health.
This shows:
- 9 HHSs consistently met the 1.25 per cent repairs and maintenance target in 2022–23 and 2023–24
- 6 HHSs did not meet the 1.25 per cent target for 2022–23 and 2023–24
- one HHS did not meet the target for 2022–23, but did for 2023–24.
Notes: Gross replacement cost is the estimated cost to construct a similar asset without adjustments for age and condition of the existing asset as of 30 June each year. CHQ – Children’s Health Queensland.
Queensland Audit Office, from Department of Health data.
As HHSs are not consistently meeting their asset maintenance targets, it is likely that assets, such as buildings, are deteriorating over time. This has resulted in an increase in the costs required to keep them in their expected condition. There could also be implications for the safety of both employees and patients. For example, lift malfunctions could affect the timeliness of patients getting to theatre.
However, for HHSs with newer assets, such as the Children’s Health Queensland facility that opened on 29 November 2014, there may be less immediate need for significant maintenance activities. The infrastructure is expected to be in better condition than that of similar buildings that are 30 to 50 years old. As these newer buildings age, the focus on maintenance will increase, making it important for HHSs to consistently meet their maintenance targets.
As we reported in Chapter 4, 7 HHSs reported an operating deficit and 2 reported a near break-even position. HHSs are expected to fund repairs and maintenance expenditure out of their own-sourced revenue. Meeting the 1.25 per cent maintenance spend target may put additional pressure on their ability to achieve a balanced budget.
All health entities should continue to work on addressing recommendations relating to maintenance needs including:
- recommendation 5 from our Health 2020 (Report 12: 2020–21) report, which was to prioritise high-risk maintenance (Appendix E)
- recommendation 2 from our Health 2023 (Report 6: 2023–24) report, which was to work together to address inconsistencies in calculating their maintenance needs (Appendix E)
- 2 new recommendations in this report relating to defining and separately reporting values for deferred maintenance, postposed capital maintenance, and forecast life cycle replacement, renewals, and refurbishments.
Self-assessments against the Queensland Audit Office’s Asset management maturity model
Approximately $23 billion of assets are held and managed by the health sector. Accordingly, it is important that entities have strong processes and controls in place to manage their assets. They also need to be aware of gaps in their processes, so they can make improvements.
In 2023–24, the HHSs self-assessed the maturity of their asset management processes using our Asset management maturity model. This self-assessment tool helps entities determine and understand the maturity of the processes they use to manage existing assets and plan for new assets.
As this was a self-assessment, we provide no assurance that the ratings reflect the actual maturity of their approaches. However, we have collated the results to show how the HHSs view the current gaps in their current level of maturity and where improvements can be made.
Each HHS’s desired level of maturity will be different. What might be required for a metro HHS may not necessarily work for smaller HHSs in regional/rural areas.
However, because HHSs have had stable business models without restructures since 1 July 2012 (when they were established), they should at least have reached the ‘established’ maturity level in the model.
The 4 levels of maturity are as follows:
| Optimised | an entity is a leader of best practice for asset management |
| Integrated | an entity’s asset management practices are fundamentally sound; however, some elements could be improved |
| Established | an entity shows basic competency in asset management |
| Developing | an entity does not have key components of asset management, or they are limited |
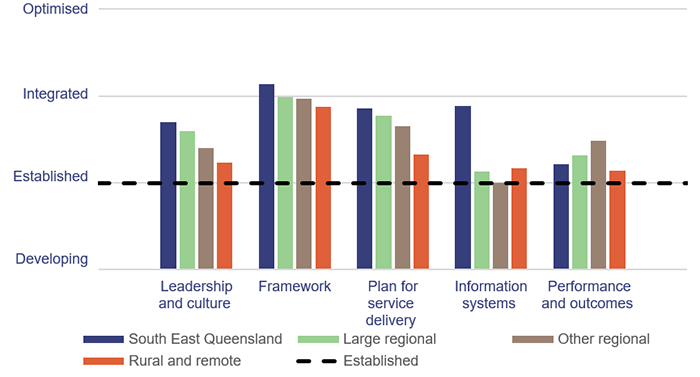
In Figure 5G, we show the self-assessed maturity levels for the HHSs per region. All HHSs show similar maturity levels, except for those in the rural and remote region.
We expected this, given the challenges of attracting staff to remote locations, and the fact that the assets in rural and remote HHSs are spread over wide geographic areas.
According to their self-assessments, all HHSs are meeting the minimum requirements to be at an established level of maturity.
Hospital and health services’ completed self-assessments against the Queensland Audit Office Asset management maturity model – 2024.
As part of the self-assessment process outlined in our Asset management maturity model, each HHS reflected on its key strengths and opportunities for improving its asset management processes. We have summarised the key themes from their self-assessments in Figure 5H.
The strategic asset management plan (SAMP) is a strategic planning tool that outlines how an agency manages its asset portfolio and plans for new assets, taking into consideration demand, service needs, stakeholder expectations, and the realities of existing assets and asset management capabilities.
| Insights |
|---|
Common improvement opportunities identified by HHSs included: Leadership and culture:
Framework:
Plan for service delivery:
Information and systems: implementing better ways/systems to monitor asset performance and life cycle costs. Performance and outcomes: refining reporting practices relating to asset management performance and maintenance targets. This will enhance transparency and accountability in tracking asset management outcomes. |
Prepared by the Queensland Audit Office, from results collated from the hospital and health services’ completed self-assessments against the Asset management maturity model – 2024.

6. Demand for health services
Demand for health services in Queensland continues to increase. This impacts on emergency departments and ambulances, even with the services provided by new satellite hospitals. It also contributes to delays in patients seeing specialists within the recommended times.
To help reduce the pressure on hospitals, Queensland Health – which includes the Department of Health (the department) and 16 hospital and health services (HHSs) – is working on a strategy to reduce potentially preventable hospitalisations. This is a challenge in a state that has a population spread over regional and remote areas, and a high level of reported acute disease.
Chapter snapshot
Notes: The increase/decrease in numbers in this snapshot shows the variation between the 2023–24 and 2022–23 financial years.
*Potentially preventable hospitalisations refer to admissions that could have been prevented with timely and adequate primary or community healthcare. These relate to 22 conditions established under the National Healthcare Agreement: Performance Indicator 18 – Selected potentially preventable hospitalisations for which a hospitalisation is considered potentially preventable.
**This is minor injury and illness clinic presentations only and does not include oral health or outpatients.
Emergency department presentations
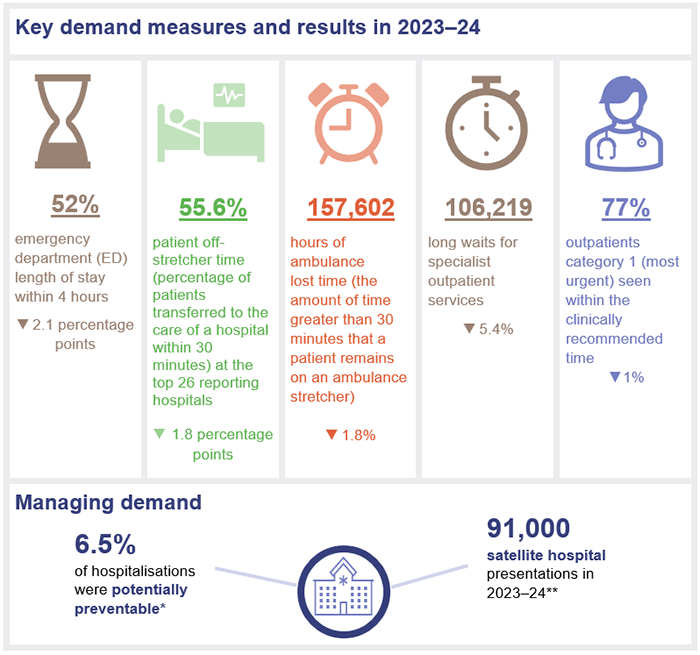
Demand for emergency department services continues to grow, and more people are arriving at emergency departments with complex issues. From 2022–23 to 2023–24, the number of presentations (excluding fever clinics episodes) at emergency departments at the top 26 reporting hospitals in Queensland increased by 2 per cent. Over the last 4 years, the cumulative growth has been 12.6 per cent.
The hospital and health service (HHS) areas that have experienced the largest increase in demand in the last 4 years are:
- Sunshine Coast HHS (22.6 per cent)
- Cairns and Hinterland HHS (19.1 per cent)
- Townsville HHS (17.1 per cent)
- Darling Downs HHS (15.9 per cent)
- North West HHS (14.9 per cent).
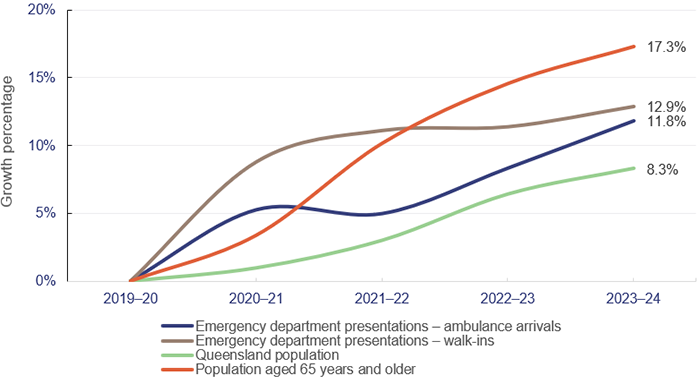
Figure 6A shows the cumulative annual growth in emergency department presentations by mode of arrival (ambulance and walk-ins) at the top 26 reporting hospitals over the last 4 years. It also shows Queensland’s population growth and ageing population over the same period.
Emergency department presentations: Queensland Audit Office, from Queensland Health – System Performance Branch for the top 26 reporting hospitals. Queensland population: quarterly Australian Bureau of Statistics population data (latest available data as of March 2024). Ageing population: Queensland Audit Office, based on data from Queensland Government Statistician’s Office and 2021 census projections.
Over the last 4 years, the increase in emergency department walk-in presentations has been greater than presentations arriving by ambulance. Overall, emergency department presentations are increasing faster than the population is growing.
Patients treated within 4 hours
In 2023–24, the top 26 reporting hospitals in Queensland finished treating people who presented at their emergency departments within 4 hours or less in only 51.9 per cent of cases. The target for Queensland is 80 per cent.
In all states of Australia, more patients are staying longer in emergency departments and fewer emergency department visits are completed in 4 hours or less. In 2022–23, Queensland ranked fourth across Australia. At 54 per cent, it was behind Northern Territory (60.6 per cent), Western Australia (60.4 per cent), and New South Wales (58.6 per cent), as shown in Figure 6B.
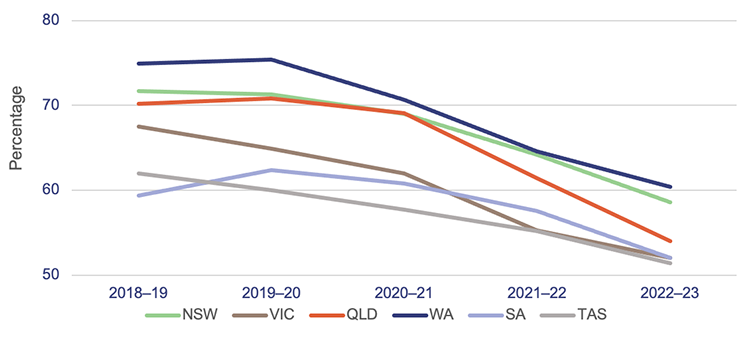
Notes: The target for emergency length of stay of 4 hours or less ranges between 75 to 90 per cent across the states. The target for Queensland is 80 per cent.
TAS – Tasmania; VIC – Victoria; SA – South Australia; QLD – Queensland; NSW – New South Wales; WA – Western Australia. Data is for all hospitals across the states. The latest-available information is up to the 2022–23 financial year.
Queensland Audit Office, from Australian Institute of Health and Welfare, My Hospitals data.
Impact of satellite hospitals
Launched in 2020, the Satellite Hospitals Program has seen the establishment of 7 new hospitals in South East Queensland, all of which opened by July 2024.
These hospitals are designed to treat non-urgent (triage) category 4 and 5 presentations to reduce emergency department demand in major hospitals. From the first satellite hospital opening in August 2023 to June 2024, there have been approximately 91,000 presentations to the minor injury and illness clinics.
| Emergency department triage categories | |
| When patients present to an emergency department, they are assessed and triaged according to the following categories of urgency: | |
| |
| Source: Australasian Triage Scale. | |
As shown in Figure 6C, 59.6 per cent of presentations to satellite hospitals were category 4, and 22.1 per cent were category 3.
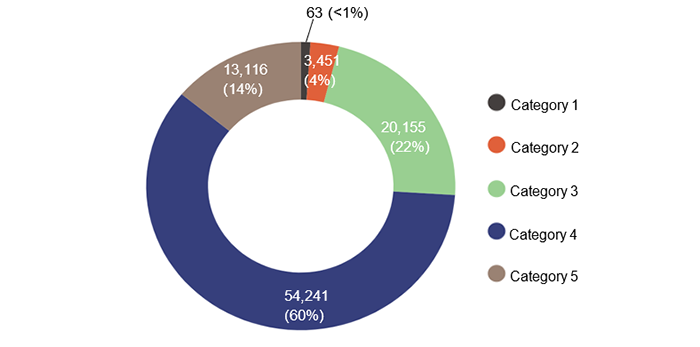
Notes: Data from August 2023, which is when the first satellite hospitals opened. Data for Bribie Island Satellite Hospital has not been included, as it only opened in July 2024, and data was not available when preparing this report.
Queensland Audit Office, from Queensland Health – Our Performance, reporting data and Queensland Health – System Performance Branch for the top 26 reporting hospitals.
Data shows there were 63 category 1 presentations (less than one per cent) and 3,451 category 2 presentations (3.8 per cent) at satellite hospitals. While these figures are proportionately low, they are consistent across each period. They indicate there may be public confusion about what medical issues the satellite hospitals are designed to treat.
They are not equipped to treat urgent issues, and if the patient needs to be moved to a nearby emergency department, their treatment may be delayed.
Figure 6D shows how non-urgent presentations at emergency departments close to satellite hospitals have changed since September 2023. Since the July–September quarter in 2023, the Ipswich Hospital emergency department has shown the greatest reduction (17.6 per cent) in non-urgent (category 4 and 5) presentations, followed by Redland Hospital at 7.4 per cent.
Notably, The Prince Charles Hospital increased by 7.7 per cent. This is because, while there is a satellite hospital 25km north of The Prince Charles Hospital, about 70 per cent of the activity at the hospital comes from suburbs to the south of it. Also, The Prince Charles Hospital is the primary paediatric centre north of Brisbane, which drives a lot of its activity for category 4 and 5 presentations.
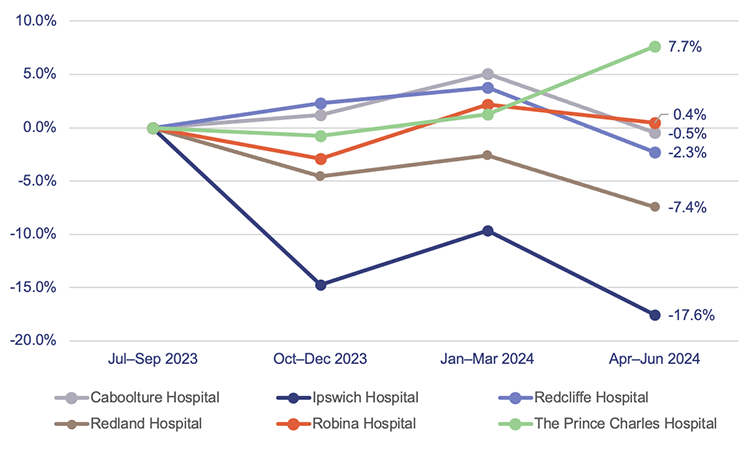
Note: The satellite hospitals linked to:
- Redland Hospital and Ipswich Hospital opened in September 2023
- Caboolture Hospital opened in August 2023
- Redcliffe Hospital and The Prince Charles Hospital opened in December 2023
- Robina Hospital opened in November 2023.
Queensland Audit Office, from Queensland Health – System Performance Branch for the top 26 reporting hospitals.
Ambulance services
Delays in hospitals have a flow-on effect on ambulances. In this section, we provide an updated analysis of the demand for ambulance services, and on Queensland Health’s and Queensland Ambulance Service’s performance against:
- response times (the time from when a call to 000 is answered to when an ambulance arrives at the scene of an emergency)
- patient off-stretcher time (POST), which measures the percentage of patients transferred to the care of an emergency department within 30 minutes
- ambulance lost time, which is measured as the amount of time greater than 30 minutes that a patient remains on Queensland Ambulance Service stretchers.
Demand for ambulance services keeps increasing
The overall demand for ambulance services has grown by a total of 10 per cent in the last 4 years. Over that time, the Queensland Ambulance Service has attended more complex and higher-priority cases and has experienced a decrease in less complex, but still urgent cases.
Since 2019–20:
- Code 1 incidents (emergency) have increased by 37.6 per cent.
- Code 2 incidents (urgent) have decreased by 14.5 per cent.
The increase in ambulance demand for emergency cases is driven by the increase in population – especially the increase in people aged 65 years and over.
According to the 2021 census, around 29 per cent of Queenslanders have one or more long-term health conditions. This contributes to an increase in more complex cases requiring ambulance services. The number of ambulance incidents (codes 1 and 2) reported under the mental health category has also increased by 29.7 per cent over the last 4 years, from about 56,000 incidents in 2019–20 to about 73,000 in 2023–24.
Comparison to other states
Queensland continues to be the Australian state with the highest number of ambulance incidents per 1,000 population. It has been since 2006–07 (which is the earliest data available in the report on government services).
A likely reason for this is that the Queensland Ambulance Service is publicly funded. New South Wales has adopted a user‑pays model, while Victoria, South Australia, and Western Australia use subscriber models.
Figure 6E shows the number of ambulance incidents by state from 2018–19 to 2022–23.
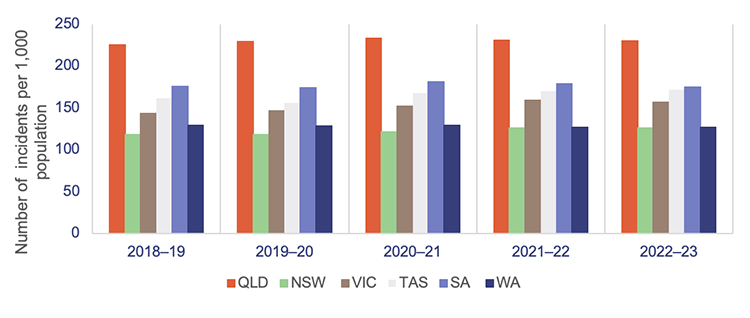
Notes: Data is for all hospitals across the states. The latest available information is up to the 2022–23 financial year. Population rates are derived using the 31 December estimated resident population of the relevant financial year. NSW – New South Wales; QLD – Queensland; SA – South Australia; TAS – Tasmania; VIC – Victoria; WA – Western Australia.
Queensland Audit Office, from Productivity Commission, Report on Government Services 2024, Part E Section 11 Ambulance services.
Ambulance response times
The Queensland Ambulance Service continues to achieve better response times for emergency cases (code 1) than most other jurisdictions, as shown in Figure 6F. This is despite having the highest number of responses in Australia in proportion to population, and a 38 per cent growth in code 1 incidents over the last 4 years.
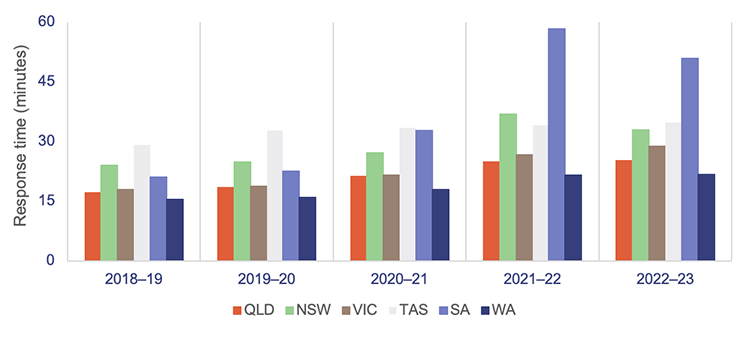
Notes: The latest available data is up to the 2022–23 financial year. *The 90th percentile refers to the time in which 90 per cent of emergency incidents are responded to.
Queensland Audit Office, from Productivity Commission, Report on Government Services 2024, Part E Section 11 Ambulance services.
As we explained earlier, ambulance response times measure how long it takes from when a 000 call is answered to when an ambulance arrives at the scene.
Performance targets for response times are measured in minutes for code 1 emergencies, but only for the:
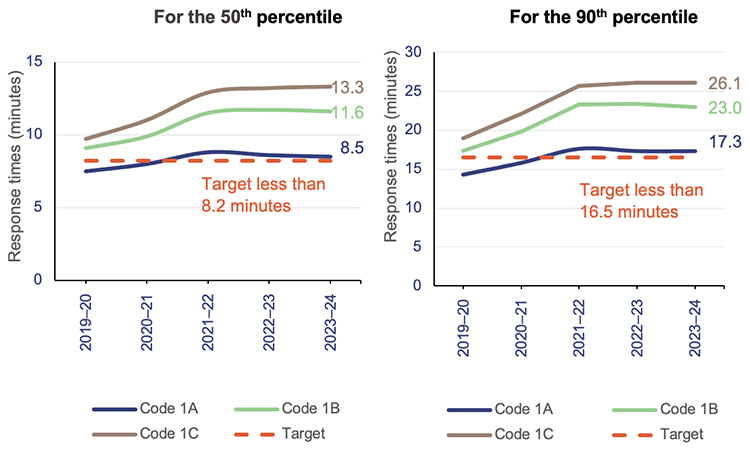
- 50th percentile – the Queensland Ambulance Service expects that 50 per cent of ambulances respond to emergency incidents (code 1) in less than 8.2 minutes.
- 90th percentile – the Queensland Ambulance Service expects that 90 per cent of ambulances respond to emergency incidents (code 1) in less than 16.5 minutes.
Code 1 response times
Code 1 incidents are potentially life-threatening events that require the use of ambulance lights and sirens.
There were 574,586 code 1 incidents in 2023–24 (59 per cent of total code 1 and 2 incidents).
The Queensland Ambulance Service did not meet its response time performance targets for code 1 incidents in 2023–24, as shown in Figure 6G.
It has not met its response time targets for priority code 1A since 2020–21. (Code 1A is ‘actual time-critical’, code 1B is ‘emergent time critical’, and code 1C is ‘potential time critical’.)
Queensland Audit Office, from data received from the Queensland Ambulance Service reporting system.
Code 2 response times
Code 2 incidents may require a fast response, but do not require lights and sirens. (Code 2A incidents require an urgent response but are not critical.)
There were 399,975 code 2 incidents in 2023–24 (41 per cent of total code 1 and 2 incidents). Response times for code 2A incidents slightly increased from 60.9 minutes in 2022–23 to 61.1 minutes in 2023–24 (for the 90th percentile).
The Queensland Ambulance Service has not set performance targets for code 2 incidents. This is because its focus is on ensuring it is responding to the most urgent cases.
Moving patients off ambulance stretchers
Queensland’s target is to have 90 per cent of patients transferred off stretchers and into the care of an emergency department within 30 minutes of arrival at the hospital. This is the clinically appropriate time frame recommended in July 2012 in Queensland’s Metropolitan Emergency Department Access Initiative report.
We note that patient off-stretcher time (POST) is not a performance measure for the Queensland Ambulance Service – it is a measure of the performance of hospital and health services (HHSs). It provides an indicator of system-wide issues due to lack of capacity in public hospitals.
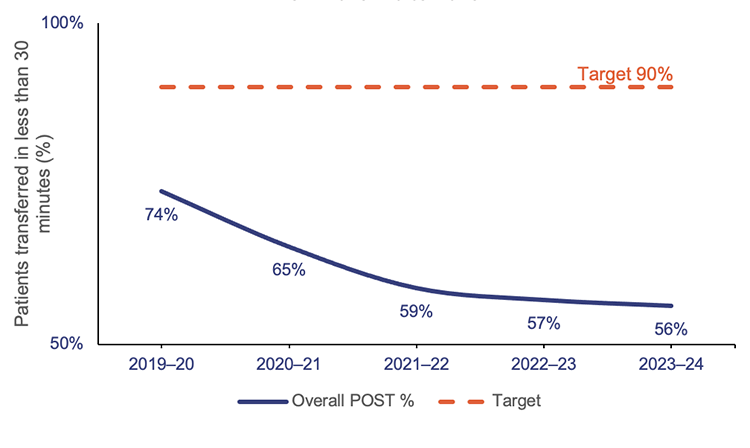
HHSs have not met the POST performance measure at the statewide level for the past 9 years. In fact, the percentage of patients transferred off stretchers in less than 30 minutes has shown a significant downward trend in the past 5 years.
As of 30 June 2024, the overall POST performance was 55.8 per cent – a decrease of around one percentage point since 2022–23. Consistent with previous years, none of the 14 HHSs with a top 26 reporting hospital met the POST target, except North West HHS.
Figure 6H shows the overall POST performance for the top 26 reporting hospitals in Queensland over the last 5 years.
Queensland Audit Office, from data received from the Queensland Ambulance Service reporting system.
The inability to meet this target is linked to the:
- number and complexity of patients presenting for treatment (both walk-ins and ambulance presentations)
- availability of ward beds
- efficiency of hospital discharge processes to free up hospital beds
- limited availability of specialists to attend patients in emergency departments.
When there is a patient off-stretcher delay, patients are cared for by Queensland Ambulance Service paramedics until the formal transfer of care to the emergency department takes place. Faster off-stretcher times ensure ambulances are available to respond to those patients waiting in the community.
The statewide POST target continues to be 90 per cent in the service delivery statements (which are service standards agreed as part of the state budget) for 2023–24. However, the department has tailored the target in its 2023–24 service agreements with each HHS. The new targets have been set to the actual POST achieved by each HHS as of 30 June 2019.
Ambulance lost time
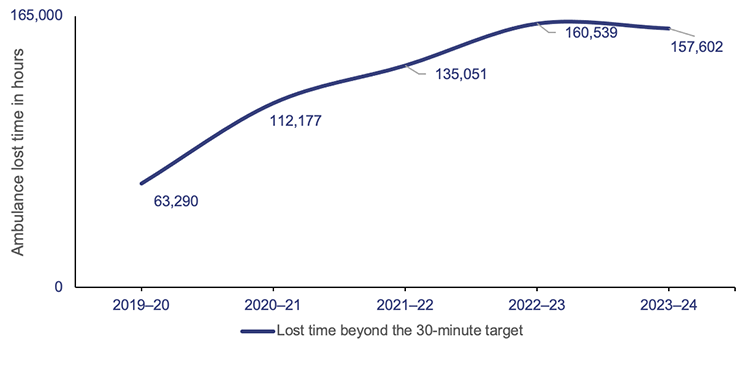
Figure 6I shows ambulance lost time in total hours at the top 26 reporting hospitals, for the last 5 financial years. (As mentioned earlier, this is the amount of time greater than 30 minutes that a patient remains on Queensland Ambulance Service stretchers.)
Queensland Audit Office, from data received from the Department of Health.
While lost time has decreased by 1.8 per cent since last year, it is significantly higher than in 2019–20, reflecting an increase of 149 per cent.
A key factor in the increase in ambulance lost time and the decrease in POST performance is the growth in emergency department demand from both ambulance patients and walk-in patients. Having more people waiting in the emergency departments means the wait times are longer.
The HHSs serving heavily populated areas have the lowest performance when it comes to moving patients off stretchers within 30 minutes. They also have the highest amount of ambulance lost time, as a result.
Specialist outpatient services
We audited specialist outpatient services in Improving access to specialist outpatient services (Report 8: 2021–22). In this section, we update key graphs from that report, and from Health 2022 (Report 10: 2022–23) and Health 2023 (Report 6: 2023–24), using data provided by the Department of Health.
Seen-within time measures whether patients attend their first appointment within clinically recommended times.
A long wait is when a patient has waited longer (by one day or more) than the clinically recommended time for a specialist appointment.
Queensland’s public hospitals use 3 urgency categories for specialist outpatient services, each with a target seen-within time (see Figure 6J).
Queensland Health calculates waiting time from the date a patient is placed on a specialist outpatient waiting list to the date they are first seen by a clinician (referred to as the ‘initial service event’). It excludes any days when a patient was not able to receive care for a clinical or personal reason.
Figure 6J has 2 target seen-within columns. The first is for the Queensland Health service delivery statement.
Since 2020–21, service delivery statements have only had a target for category 1 specialist outpatients seen-within time. There have been no targets for categories 2 and 3, partly due to the impacts from responding to COVID-19. The other reason is because of the system’s focus on reducing the volume of patients waiting longer than clinically recommended.
The other column is for the department’s service agreements with the HHSs, which include targets for all 3 categories.
| Urgency category | Appointment required within | Target seen-within time (service delivery statement) | Target seen-within time (service agreements) |
|---|---|---|---|
Category 1 | 30 calendar days | 83% | 90% |
Category 2 | 90 calendar days | - | 85% |
Category 3 | 365 calendar days | - | 85% |
Queensland Audit Office from Specialist Outpatient Services Implementation Standard and Queensland Health service delivery statements and service level agreements.
Figure 6K shows the percentage of outpatients seen by a specialist within clinically recommended times for each category. Queensland Health consistently met or closely met the target for category 1 patients from 2016–17 to 2020–21, but it has not met the targets for any of the 3 categories from 2021–22 to 2023–24.
In fact, its 2023–24 results were the lowest in the last 9 years for category 1 and category 2, although there were improvements in category 3.
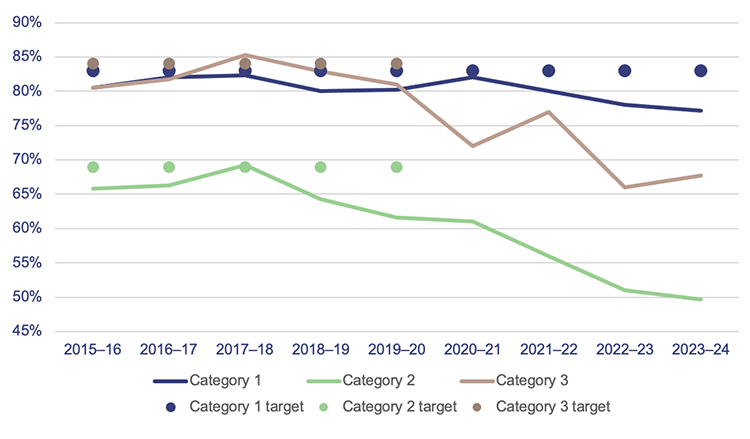
Note: The target is per service delivery statements.
Queensland Audit Office, from Queensland Health specialist outpatient data collection.
Despite hospitals not achieving these seen-within targets, the number of patients being seen has increased by 8.7 per cent from 2022–23 (see Figure 6L).
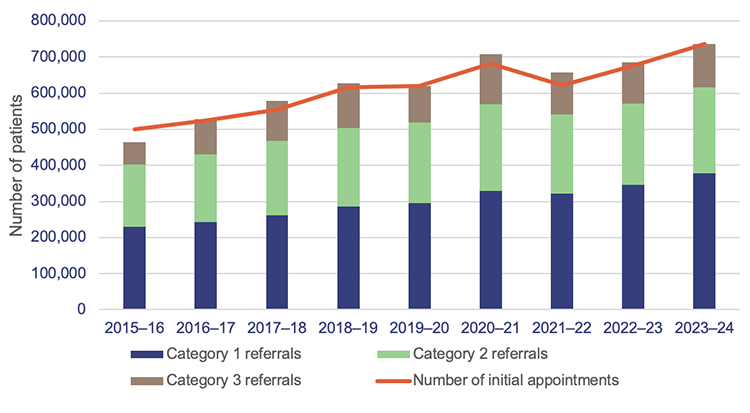
Queensland Audit Office, from Queensland Health specialist outpatient data collection.
Long waits
Figure 6M shows that the total number of long waits halved in the first 3 years of Queensland Health’s Specialist Outpatient Strategy, which began in July 2015. But the total number of long waits as of 1 July 2024 is 29 per cent higher than it was on 1 July 2015.
In 2021–22, the total number of long waits increased by 80 per cent due to the impacts of COVID-19 on system capacity.
It appears that long waits reached their overall peak in 2022–23 at 112,000, with a reduction this year of 5.4 per cent. In 2023–24, almost 59,000 patients were seen, which helped to reduce these long waits. While the HHSs are working through the backlog of patients, new patients are being placed on waitlists.
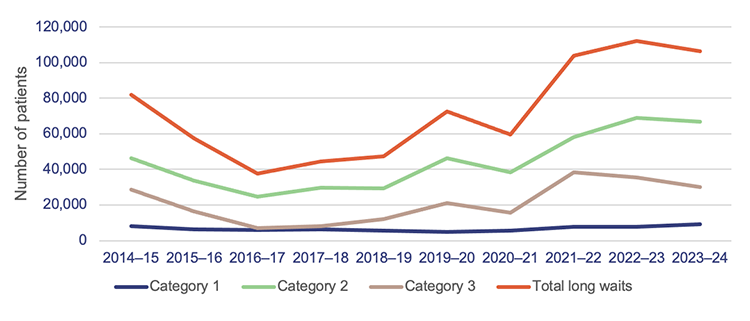
Queensland Audit Office, from Queensland Health specialist outpatient data collection.
Virtual healthcare
In its service agreements with HHSs, the department has provided an incentive for increasing virtual models of care (for example, telehealth) to decrease pressure on acute facilities. HHSs received incentive funding when they met their targets for the financial year. These targets were based partly on an expectation that doctors would deliver more services to patients through virtual care.
In 2023–24, HHSs were paid an incentive of $73.50 per virtual care service event above the 30 per cent target and up to an agreed upper limit. Of the 16 HHSs, 8 reached the upper limit. The department paid $7.4 million for this incentive in 2023–24.
Potentially preventable hospitalisations
Early intervention and access to proper care in primary healthcare – such as that offered by general practitioners and community health services – play an important role in minimising hospital admissions.
In 2023–24, over 190,000 hospitalisations among Queensland residents were potentially preventable – about 6.5 per cent of all hospitalisations in the state. Addressing health issues early and providing timely care (through primary and community health care) can reduce many of these hospitalisations.
Potentially preventable hospitalisations (PPH) refer to admissions that could have been prevented with timely and adequate primary or community healthcare. This care includes services provided by general practitioners, medical specialists, dentists, nurses, and allied health professionals. For example, acute conditions like cellulitis and urinary tract infections are considered potentially preventable. Injuries like a broken leg from a car accident are not.
There are 22 conditions for which a hospitalisation is considered potentially preventable, across 3 broad categories – chronic, acute, and vaccine-preventable. These categories are based on national standards outlined in the National Healthcare Agreement: Performance Indicator 18 – Selected potentially preventable hospitalisations. All states and territories, including Queensland, are required to follow these standards to measure the effectiveness of primary and community care.
Queensland has higher reportable rates of acute conditions than other states and territories, except for the Northern Territory. In 2023–24, the most common PPH conditions in Queensland were urinary tract infections (12.8 per cent of all PPHs), cellulitis (11.1 per cent), and dental conditions (10.7 per cent).
The types of potentially preventable hospitalisation conditions also vary by age group. Older adults are more likely to be hospitalised for chronic conditions, such as chronic obstructive pulmonary disease and congestive cardiac failure. In contrast, people under 20 years of age are more likely to be admitted for acute conditions. This includes ear, nose, and throat infections; pneumonia (not vaccine-preventable); and dental issues.
Over half of potentially preventable hospitalisations (51.5 per cent) occur in individuals aged 60 and over, with the highest number of episodes among adults aged 85 and over.
Comparing potentially preventable hospitalisations across jurisdictions
From 2012–13 to 2021–22, Queensland consistently ranked as the second-worst jurisdiction nationally for potentially preventable hospitalisation rates. Figure 6N provides a comparison.
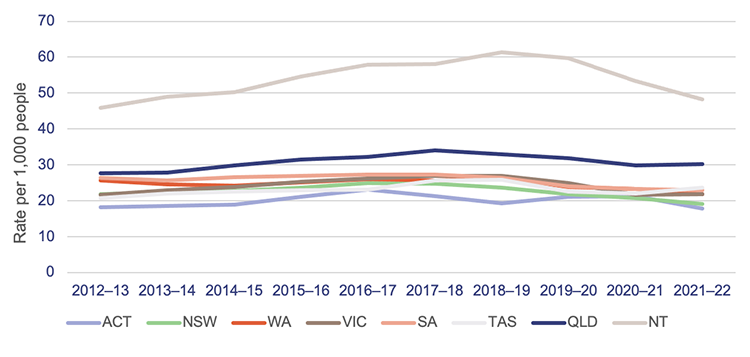
Note: ACT – Australian Capital Territory; NSW – New South Wales; NT – Northern Territory; QLD – Queensland; SA – South Australia; TAS – Tasmania; VIC – Victoria; WA – Western Australia.
Queensland Audit Office, from the Productivity Commission, Report on Government Services 2024 Part E, Section 10 Primary and community health.
The department and selected hospital and health services (HHSs) have advised that there may be several factors contributing to Queensland's rates of potentially preventable hospitalisations.
Data from 2021–22 shows that people living in remote or very remote areas of Queensland are more likely to be hospitalised for potentially preventable conditions. People living in remote and very remote areas are admitted at 1.6 to 1.8 times the rate of people living in major cities.
Additionally, Aboriginal and Torres Strait Islander people in Queensland are 2.6 times more likely to be admitted compared to the state’s wider population. Compounding this is the fact that access to essential health services, such as general practitioners and dental clinics, is often limited in rural and remote areas.
Addressing these challenges requires a coordinated effort between various stakeholders, including the state and federal governments.
The Australian Government is responsible for providing equitable and timely access to general practice and primary health care services. In Queensland, the department manages public hospitals in collaboration with the HHSs. The department also plays an active role in minimising potentially preventable hospitalisations, because these conditions increase demand for acute hospital services and associated expenditure.
Developing a strategy to reduce preventable hospitalisations
The department has invested in several initiatives to manage increasing patient demand, including rapid access clinics that aim to provide faster care for patients who need urgent assessment and treatment. It has also set up virtual hospitals, which allow patients to access specialist emergency care by phone or video conferencing. Additionally, telehealth services and minor injury and illness clinics are available.
While these initiatives may help address potentially preventable hospitalisations, there is currently no overarching strategy with clear objectives, outcomes, and targets for reducing them.
The department’s previous strategy, My health, Queensland’s future: Advancing health 2026, included reducing potentially preventable hospitalisation admissions as a key performance indicator. However, the new HEALTHQ32 framework, which replaced the previous strategy, did not at the time of our audit. (Some performance indicators for First Nations people remain in service-level agreements with the HHSs.)
In August 2024, we recommended that the department define its strategic objectives for reducing potentially preventable hospitalisations and develop performance indicators and targets. The department accepted our recommendation and plans to implement it in a 2-phase approach by 30 June 2026. Phase one involves analysing preventable hospitalisations trends, patient cohorts, and regional data, while phase 2 focuses on designing a strategy and setting performance targets.

2024 hospital and health service dashboard
Find your local hospital and health service (HHS) in this Queensland Audit Office visualisation to explore its financial audit data for 2024 and compare to other hospital and health services. This interactive tool includes data on revenue, expenses, assets, liabilities and activity measures.

