Overview
Queensland is the second largest state in Australia and has the most people living outside greater capital city areas. Queensland’s regions (referring to all areas outside Greater Brisbane) cover around 99 per cent of the state. It ranges from coastal cities, like the Gold Coast, through to the Far North, to more remote outback areas. Our regions are home to diverse regional economies and environments, reflected in significant industries like mining, manufacturing, agriculture, and tourism.
Tabled 13 June 2024.

Report on a page
This report brings together regional insights from our financial audits across government entities. It is the first in a series that will complement our annual sector-based reports by examining different aspects of government support of Queensland’s regions.
Queensland’s regions are diverse and vast
We use the term ‘regions’ to refer to all areas outside of Greater Brisbane. This represents around 99 per cent of the state’s land mass, and ranges from coastal cities like the Gold Coast through to remote areas in Queensland’s outback. The regions are home to diverse natural environments, reflected in significant industries like mining, manufacturing, agriculture, and tourism.
Of all the states and territories, Queensland has the most people who live outside the greater capital city areas. Around three-quarters of all Queenslanders live in the regions, and the population is expected to grow over the next 20 years. More demand for government services in the regions will follow, along with a greater need for coordinated planning, economic, and social development activities.
The government supports and invests in the regions
All Queensland Government departments are responsible for policies, programs, and services that impact on the regions. Around 64 per cent of all Queensland Government employees are based in the regions. The vast majority are in frontline roles, including healthcare workers, teachers, and first responders. Many Queenslanders are also employed by the local governments (councils) that deliver services across the state.
The government supports economic outcomes throughout the regions, by providing grants and investing in infrastructure, and through its policies, such as promoting the use of local suppliers when purchasing goods and services. Between 2021 and 2023, government departments provided approximately $1.1 billion in grants to support regional businesses and local governments with infrastructure investment and to assist them in growing their economies and employment.
Growing the regions requires coordination
One of the Queensland Government’s community objectives is to ‘help Queensland’s regions grow by attracting people, talent, and investment, and driving sustainable economic prosperity’. Government entities share responsibility for achieving this.
Coordinating across government to deliver regional growth initiatives is an ongoing challenge. For example, most state entities divide the state up differently, which can complicate how they plan their activities and work together.
Some of the government’s regional growth functions have been frequently moved between entities through machinery of government changes. For example, responsibility for regional planning has shifted between departments 5 times since 2015. These constant disruptions introduce risks to achieving strategic initiatives and project delivery.
The Queensland Government is implementing a new regional governance model to improve how entities work together. The government is also updating statutory regional plans for 10 regions across the state, intending to align economic drivers, infrastructure priorities, and land use planning.
We may examine these initiatives and challenges for regional growth in future reports.
Reference to comments
In accordance with s. 64 of the Auditor-General Act 2009, we provided a copy of this report to relevant entities. In reaching our conclusions, we considered their views and represented them to the extent we deemed relevant and warranted. Any formal responses from the entities are at Appendix A.
1. Queensland's regions
Queensland is the second largest state in Australia, spanning over 1.72 million square kilometres. For perspective, that is more than 7 times the size of Great Britain. Outside of the Greater Brisbane area, Queensland is home to diverse regional economies and environments.
In this chapter, we define Queensland’s regions and discuss their significant contribution to the state. This includes the populations in Queensland’s regions and the major regional industries that contribute to Queensland’s economy and communities.
Our focus
This report is the first in a series that will examine different aspects of government service delivery and support to Queensland’s regions. We will prepare these reports using information and insights we gather through our financial audits. They will complement our sector-based results of financial audit reports.
We begin our series by presenting important economic data on Queensland’s regions and information on a range of services and investments the state and local governments provide. We also explore how the Queensland Government is working towards its stated objective of helping ‘Queensland’s regions grow by attracting people, talent, and investment, and driving sustainable economic prosperity’.
In future years, we will examine different aspects of government services in Queensland’s regions. For example, our future reports may further examine the types of financial assistance government provides when regions respond to and rebuild after natural disasters.
While this report primarily focuses on state government entities, we recognise that local governments are integral to the growth and prosperity of Queensland’s regions. Our report, Local government 2023 (Report 8: 2023–24), summarises the audit results of all local governments in Queensland and discusses their important roles and functions.
The Australian Government also provides funding to the Queensland Government, local governments, and the private sector for infrastructure investment and economic growth. Its role is outside the scope of this report.
Throughout this report, we present information from publicly available data. We have selected the most recent and reliable data available. As a result, some data presented in this report is for differing time periods. We provide more information on how we prepared this report in Appendix B.
How are Queensland’s regions defined?
There is no single, agreed-upon definition of Queensland’s regions. Many state government entities divide the state in different ways to align with how they provide services. We use the following definition:
In this report, Queensland’s regions refer to all geographic areas outside of Greater Brisbane. This reflects the Regional Australia Institute’s definition of ‘regional Australia’ as all areas outside of the major capital cities.
We present information about Queensland’s regions using ‘statistical area levels’ developed by the Australian Bureau of Statistics. This approach divides Queensland into unique areas based on population.
Where possible, we present regions using Statistical Area 4 level (SA4). These areas typically have a population of more than 100,000 people. In some cases, we provide analysis at the more detailed Statistical Area 3 level (SA3), particularly in vast regions like Outback Queensland that have fewer people.
When we present information about the Brisbane area, we group 5 SA4 regions together to form Greater Brisbane (see the definition box below). This does not always match terms such as ‘Metropolitan Brisbane’ or ‘the Brisbane local government area’.
In this report, Greater Brisbane refers to the 5 SA4 regions with Brisbane in their title – Brisbane North, Brisbane South, Brisbane East, Brisbane West, and Brisbane Inner City. This encompasses most of the Brisbane City Council and Redland City Council local government areas.
When we refer to ‘Queensland’s regions’, we are not including Greater Brisbane. However, in some instances, we include Greater Brisbane in graphs or figures for comparative purposes.
How many people live in Queensland’s regions?
Queensland is home to over 5.4 million people. Around 4 million people, or three-quarters of all Queenslanders, live in the regions. This is more than the combined population of Western Australia, Tasmania, and the Australian Capital Territory. Queensland also has the largest regional population of any Australian state or territory.
Some regions have much larger populations than others. For example, the Gold Coast and Sunshine Coast regions together are home to around 20 per cent of the state’s population, while Outback Queensland accounts for approximately 2 per cent of the population despite representing 68 per cent of the state’s land mass.
Figure 1A depicts Queensland’s population by region.
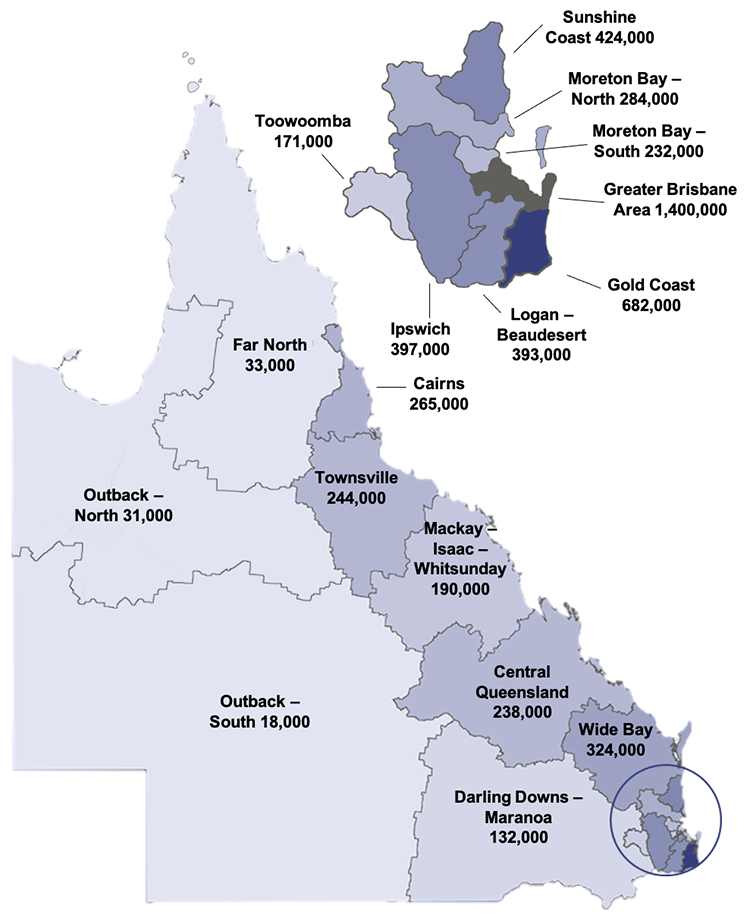
Compiled by the Queensland Audit Office using information from the Australian Bureau of Statistics for 2023.
Most of Queensland’s regions are growing
The population in most of Queensland’s regions has grown over the past 5 years, with the most substantial growth happening in the Logan – Beaudesert, Ipswich, and Moreton Bay – North regions. Outback – South is the only region in Queensland to have seen a decline in population over this period.
Figure 1B shows the annual average historical and projected population change in Queensland.
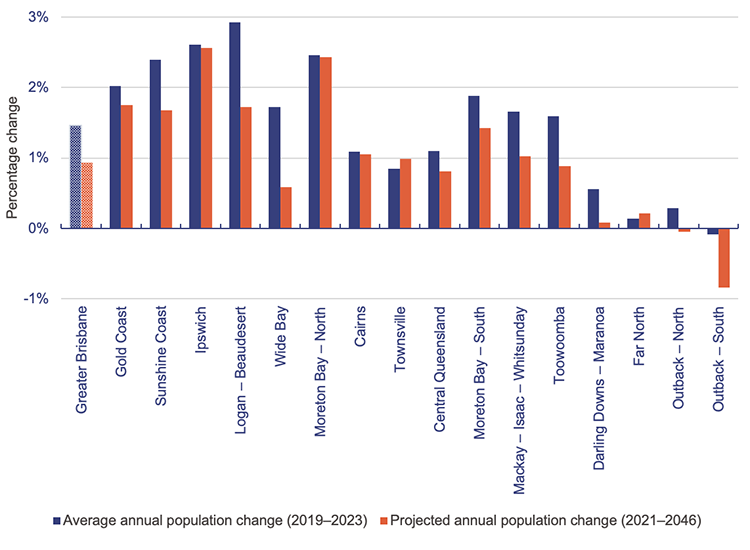
Notes: Regions are presented in order of total population from largest to smallest. Average and projected growth are calculated from the compounded annual growth rate for each region.
Compiled by the Queensland Audit Office using information from the Australian Bureau of Statistics and Queensland Government Statistician’s Office.
Queensland’s population is expected to continue to grow over the next 20 years. The state’s current population of around 5.4 million people is forecast to increase by almost 34 per cent by 2046 to around 7.3 million. An additional 1.6 million people are expected to be living across the regions.
Populations are also changing within the regions
Some regions are experiencing a faster ‘ageing’ of their population as the number of people aged over 65 increases. For example, between 2018 and 2022, the Moreton Bay – North, Cairns, Mackay – Issac – Whitsunday, and Central Queensland regions had an average annual growth rate of close to 5 per cent for people over 65 years, while the Darling Downs – Maranoa, Outback – South, and Outback – North regions had less than 3 per cent.
As the regions grow, there is likely to be a greater demand for government services. A changing population can also impact the sorts of government services needed, for example, an ageing population may need less schools but require more health and aged-care services. There will also be a greater need for coordinated planning and economic development activities to ensure regional economies are sustainable and prosperous.
What jobs and industries do people work in?
Queensland is home to diverse natural environments, and industries vary across the state to reflect the natural resources. For example:
- Parts of the state are critical to Queensland’s mining and energy sector, with dense mineral deposits and proximity to mining basins.
- Some areas are home to major cattle, agriculture, aquaculture, and manufacturing producers, or have access to key ports and transport and logistics hubs.
- Certain regions attract tourism with their iconic natural features and attractions.
These regionally-focused industries are significant contributors to Queensland’s economy, representing almost $135 billion (approximately 30 per cent) of total gross state product (GSP) in the 2022–23 financial year, as detailed in Figure 1C.
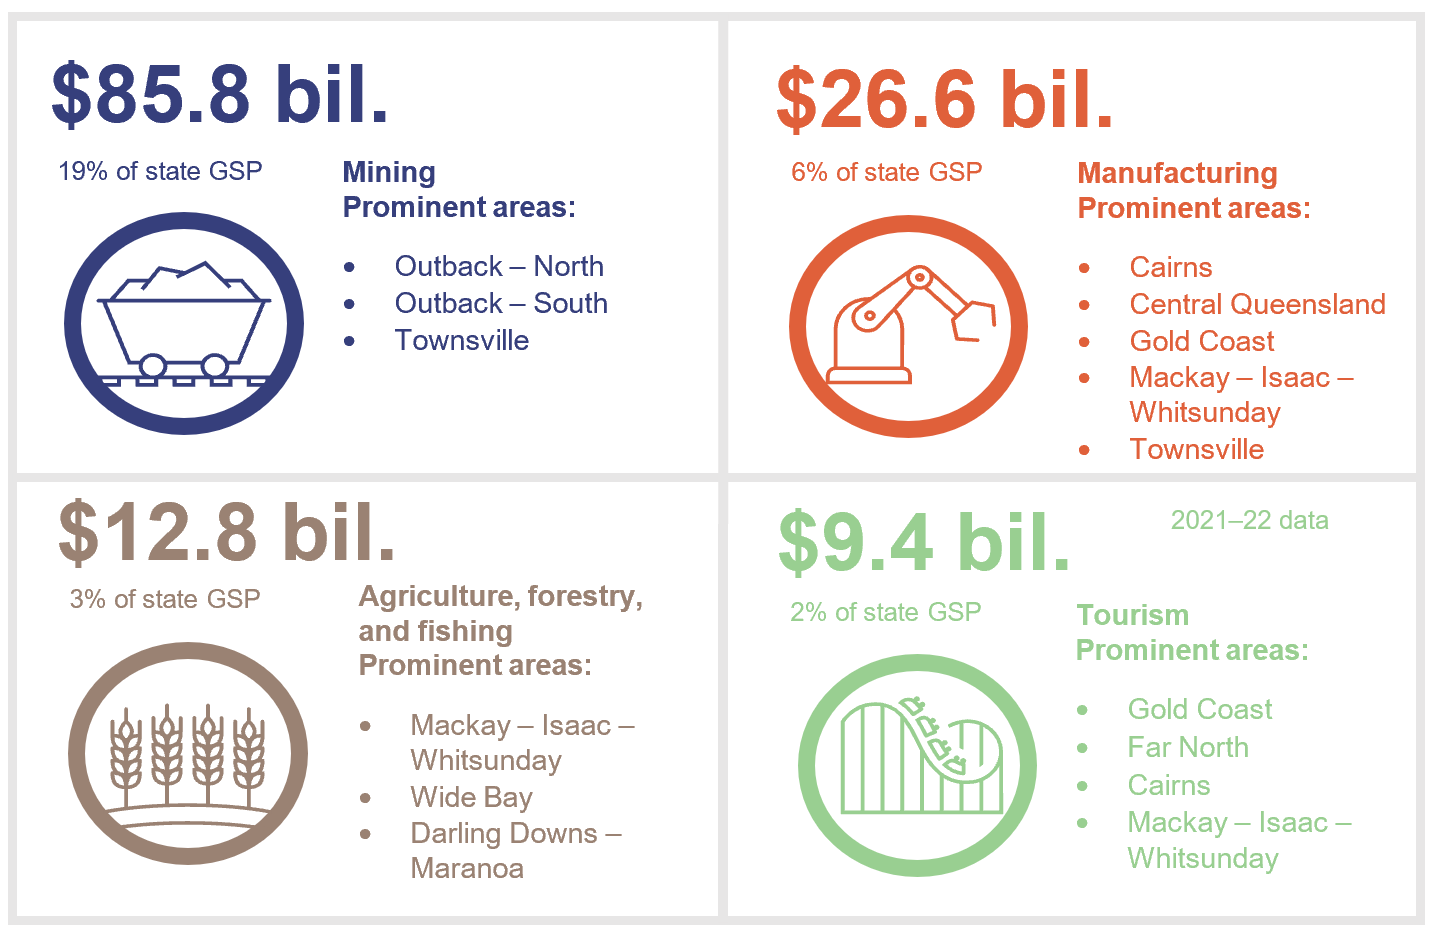
Notes: Gross state product is the total economic production of a state economy. Industries selected are predominantly located in the regions, however they may also have economic activity in the Greater Brisbane area.
Compiled by the Queensland Audit Office using gross state product statistics for 2022–23 from the Queensland Government Statistician’s Office, and information from Queensland Treasury.
Regional employment and income snapshot
While mining produces significant economic outputs, the healthcare and social assistance industry is the single biggest employer in Queensland’s regions. This includes professions in healthcare, childcare, welfare and associated support, and administrative roles.
Other industries, such as construction and manufacturing, employ a larger proportion of the population in the regions than they do in Greater Brisbane. Unemployment is also higher in Queensland’s regions, at 4.2 per cent, compared to 3.7 per cent in Greater Brisbane as at March 2024. Although some individual regions have a lower unemployment rate than Greater Brisbane.
Figure 1D sets out the 6 highest-employing industries in the regions.
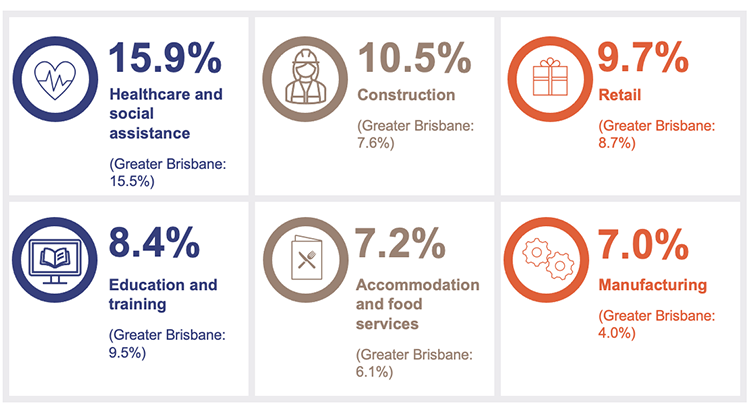
Note: This shows the top 6 industries based on the number of jobs in each region.
Compiled by the Queensland Audit Office using information from the Australian Bureau of Statistics.
The median weekly income across Queensland’s regions is 23 per cent lower than it is in Greater Brisbane. However, this varies a lot between individual regions.
For example, the median income in the Moreton Bay – South region is almost double the median income in Wide Bay. (Wide Bay has the lowest proportion of people of working age, between 15 and 64 – about 10 per cent less than Moreton Bay – South.)
Figure 1E shows the median weekly income across the regions.
Notes: We have calculated Greater Brisbane’s median income by taking the average income of the 5 Brisbane SA4 geographical areas. Due to the availability of data, we present Queensland – Outback as a single SA4 region, rather than at the lower SA3 levels used elsewhere in this report.
Compiled by the Queensland Audit Office using information from the Australian Bureau of Statistics.
2. Government activity in the regions
The Queensland Government, along with local governments (councils), plays a vital role in supporting the regions. Each region requires different government services and investments to meet its varying needs. In this chapter, we discuss some of the services and investments the Queensland Government delivers in the regions.
All Queensland Government departments are responsible for policies, programs, and services that affect the regions. Many departments have a physical presence, often through a network of regional offices, such as:
- customer service centres operated by the Department of Transport and Main Roads
- child safety service centres operated by the Department of Child Safety, Seniors and Disability Services
- offices, research stations, and facilities operated by the Department of Agriculture and Fisheries
- housing service centres operated by the Department of Housing, Local Government, Planning and Public Works.
Some frontline service entities have a significant regional presence across the state. Figure 2A provides an overview of the frontline services commonly found throughout Queensland.
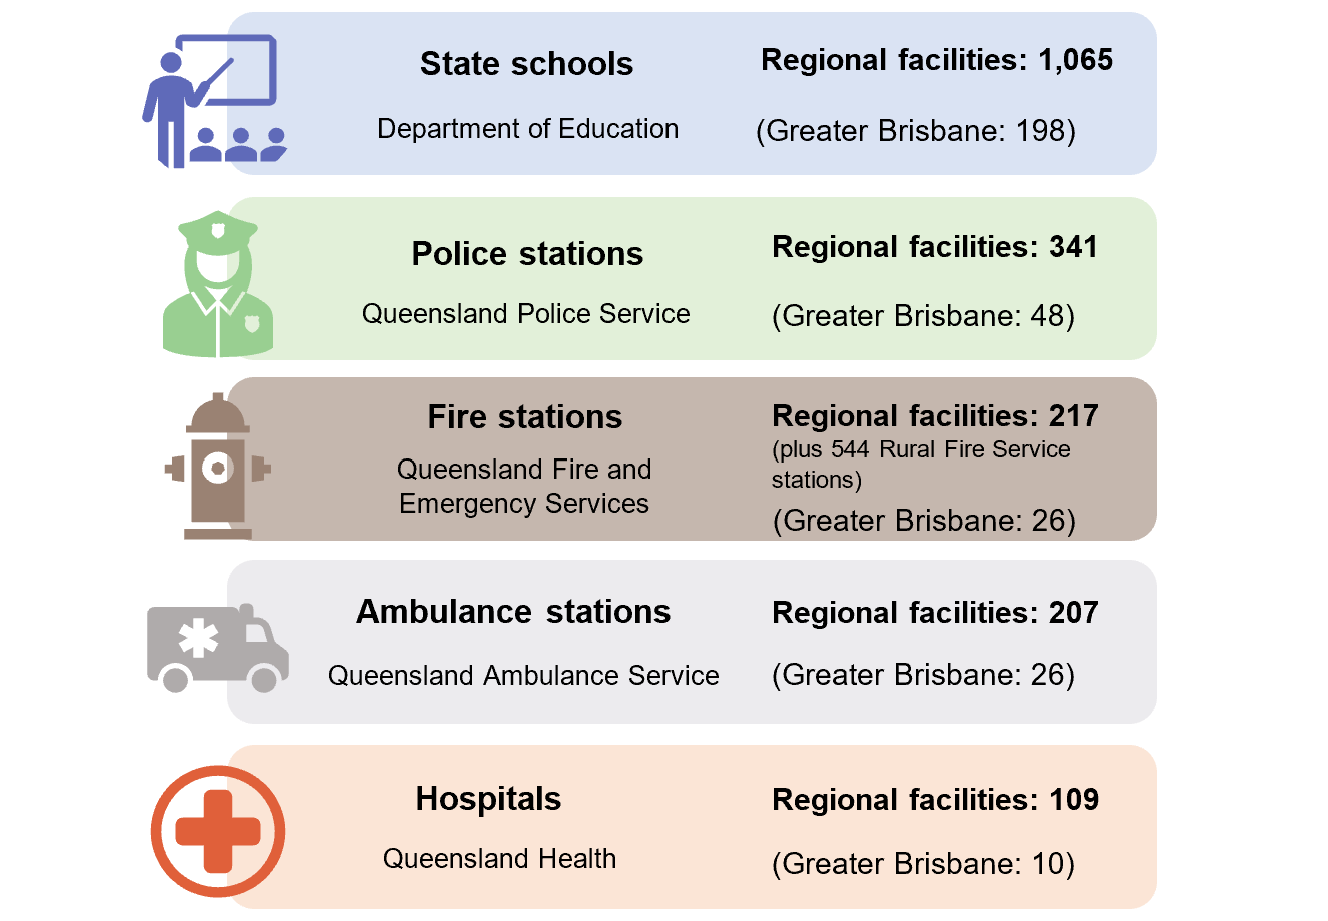
Compiled by the Queensland Audit Office from information published by Queensland Government entities.
How many government employees are based in Queensland’s regions?
The Queensland Government is a significant employer in Queensland’s regions. Approximately 64 per cent of all state government roles are based in the regions, representing around 157,700 full-time equivalent employees. The majority of these are frontline roles, as shown in Figure 2B.
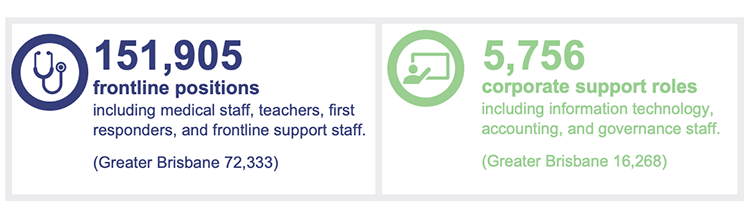
Notes: This figure represents full-time equivalent employees. It excludes employees in local governments, government owned corporations, and most statutory bodies.
Compiled by the Queensland Audit Office from the Queensland public sector workforce profile published by the Public Sector Commission as at March 2023.
How many Queenslanders are employed by local governments?
Local governments are responsible for the delivery of a wide range of community services, such as roads, water, and waste; and in some cases, aged care and child care. Councils across Queensland are collectively responsible for managing 1.7 million water connections; 150,118 kilometres of roads; and 1.7 million tonnes of waste.
There are 77 local governments in Queensland. Of these, 75 are in the regions, and they employ around 30,700 Queenslanders. In many communities, local governments are the largest single employer. We discuss many of their functions in Local government 2023 (Report 8: 2023–24), which also summarises their audit results.
How does the Queensland Government invest in the regions?
The Queensland Government supports economic outcomes throughout the regions by:
- awarding grants to community groups, local governments, businesses, and others
- providing new and enhanced infrastructure, including roads, schools, and hospitals
- purchasing goods and services from local suppliers (and having policies that encourage this).
What grant funding is provided to the regions?
Each year, Queensland Government departments and the Queensland Reconstruction Authority publish information on the government’s Open Data website about the funding provided for frontline services and grant programs.
To accompany our report State entities 2023 (Report 11: 2023–24) we refreshed the Understanding grants dashboard on our website, which now visualises the government’s grants data from 2021 to 2023. It shows information on grants paid by the Queensland Government and compares local government areas. We have also used this data to compile the information on grant funding in this report.
Between 2021 and 2023, Queensland Government departments distributed around $6.3 billion in grant payments (excluding payments to other state government entities). The Queensland Reconstruction Authority distributed an additional $2.1 billion in response to disasters.
Grant payments are often made after natural disasters
The Disaster Recovery Funding Arrangements (DRFA) is a joint Australian and state government funding program that provides financial assistance to help communities recover from certain natural disasters. The Queensland Reconstruction Authority manages DRFA on a whole-of-government basis in Queensland.
The DRFA was activated 28 times between 2021 and 2023, with various bushfire, cyclone, flooding, and storm events affecting nearly every local government area in Queensland.
The DRFA provides different types of funding assistance to individuals, businesses, community groups, local governments, and state government entities. Figure 2C outlines the types of assistance and who receives them.
| Type of funding assistance | Purpose | Recipients |
|---|---|---|
| Personal hardship assistance | This is an emergency helping hand to alleviate personal hardship and distress and assist in addressing immediate needs. | Individuals |
| Disaster assistance grants | The Essential Services Safety and Reconnection Scheme (for individuals) provides for financial contributions towards repair work for electrical, water, gas, and sewerage connections. The Freight Subsidies to Primary Producers (for businesses) is for moving essential materials such as fodder, building and fencing materials, and machinery. | Individuals Businesses |
| Disaster assistance loans | There are various loan types for not-for-profit organisations, small businesses, and primary producers designed to assist with assets that have been significantly damaged, or to meet needs because of a significant loss of income. | Businesses Community groups |
| Special disaster assistance grants | These are grants for primary producers (businesses) to provide short-term targeted assistance for clean-up, removal of debris, disposal of deceased livestock, and reinstatement, where the impact on the farming sector has been particularly severe and this could result in production and viability being disrupted beyond the current season. It also covers grants for small businesses and not-for-profit organisations (community groups) to cover clean-up and reinstatement costs arising out of direct damage caused by a disaster, when the impact on the area has been particularly severe, and the community is at risk of losing essential businesses. | Businesses Community groups |
| Counter-disaster operations | This is intended to assist in preparation for, or in response to, a disaster, providing assistance to individuals to reduce personal hardship and distress, or to protect the general public. | Local governments |
| Reconstruction of essential public assets | This is for repairing and permanently reconstructing essential public assets (such as roads and stormwater infrastructure) damaged by a disaster. | Local governments |
| Community recovery funding | This is intended to assist severely impacted communities with their medium- to long-term recovery by providing funding for activities/projects aimed at community recovery, community development, community resilience, and capacity building for the future. | Local governments |
| Extraordinary special assistance | This is to provide relief or recovery to alleviate distress or damage in circumstances that are exceptional. | Local governments Businesses Community groups |
Notes: Funding for special disaster assistance grants, community recovery funding, and extraordinary special assistance is only provided in certain circumstances. It requires joint agreement by the Prime Minister of Australia and the Premier of Queensland. State government entities can receive some categories of funding (for example, the Department of Transport and Main Roads receives funding for the reconstruction of roads). We have excluded these payments, as they are between state government entities.
Compiled by the Queensland Audit Office from the Queensland Disaster Funding Guidelines 2021.
Between 2021 and 2023, the Queensland Reconstruction Authority reported approximately $2.1 billion in grants paid under the DRFA. Figure 2D shows the amount of funding for each region and the types of recipients.
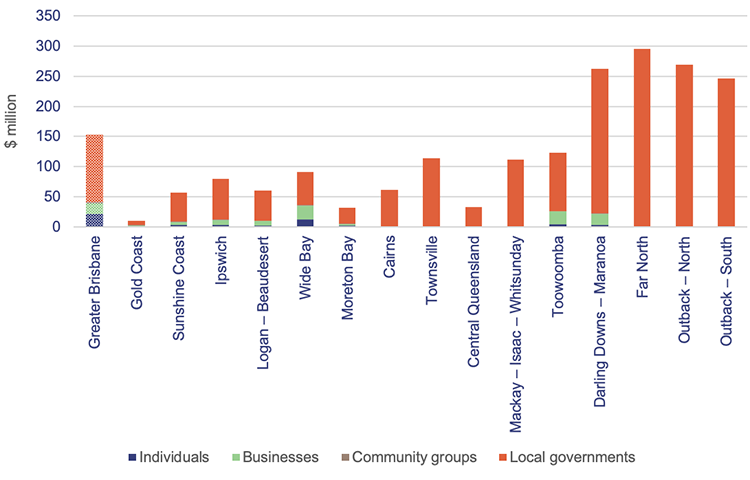
Note: We use Moreton Bay here, instead of Moreton Bay – North and Moreton Bay – South, as it was not possible to identify the location based on the data available (refer to Appendix E).
Compiled by the Queensland Audit Office based on information on the Queensland Government’s Open Data website.
Due to the large amount of damage to infrastructure caused by natural disasters, local governments receive the highest amount of funding for the reconstruction of essential public assets. Between 2021 and 2023, local governments in the sparsely populated outback regions received the highest payments to address widespread damage caused to local infrastructure, primarily from multiple flooding events.
There is a time lag between when a disaster happens and when funding is provided to local governments for reconstructing their assets. Local governments typically have 2 years from when the event occurs to complete the work, with the Queensland Reconstruction Authority providing funding to them progressively. This means the amounts reported in Figure 2D include funding for events prior to 2021.
The Queensland Audit Office’s Forward work plan 2023–26 includes an audit topic that will examine how effectively state and local government entities prepare for natural disasters.
Grant programs support regional economic development and employment
Various government departments provide grant funding that supports regional economic development and employment. Departments paid approximately $1.1 billion to individuals, businesses, community groups, and local governments between 2021 and 2023 to support employment. Of this, 88 per cent went to Queensland’s regions.
Figure 2E shows the amount of funding for each region and the types of recipients.
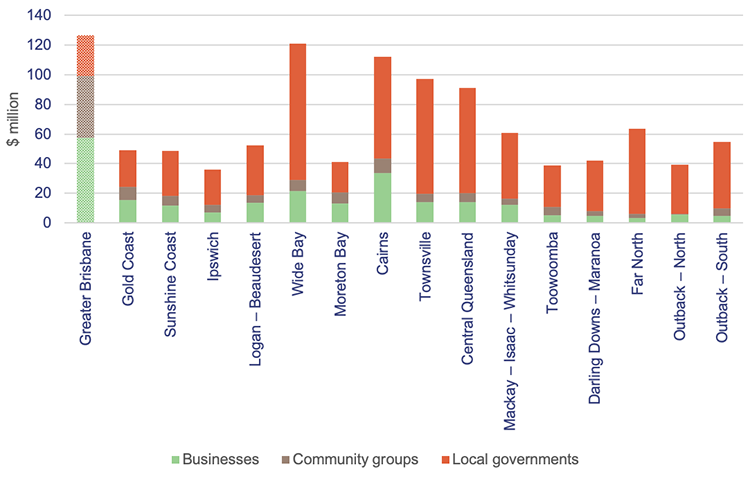
Notes: We use Moreton Bay here, instead of Moreton Bay – North and Moreton Bay – South, as it was not possible to identify the location based on the data available (refer to Appendix E). Individuals also received approximately $153,000 in grants, which is not included in this figure.
Compiled by the Queensland Audit Office based on information on the Queensland Government’s Open Data website.
Appendix C provides more information on a selection of these grant programs.
There is a new future fund to support regional economies
In the 2023–24 budget, the government provided $200 million to establish the Regional Economic Futures Fund. This fund, to be administered by the Department of State Development and Infrastructure, targets regions which:
- include communities that have coal-fired power stations and associated mines that are a significant source of economic activity and jobs
- have unique opportunities to support new industries like critical minerals, renewable energy, hydrogen, and biofuels.
It will cover the following areas:
- North West Queensland (including the corridor to Townsville), which is part of the Outback – North and Townsville regions in this report
- Greater Whitsunday, which is part of the Mackay – Isaac – Whitsunday region in this report
- Central Queensland
- Darling Downs, South West, and South Burnett, which are part of the Darling Downs – Maranoa, Outback – South, and Wide Bay regions in this report.
Each region will have a regional transformation strategy and implementation plan. The department expects these strategies and plans to be drafted and ready for implementation in mid-2024.
How do major infrastructure projects drive regional growth?
Governments spend a significant portion of their budgets on capital expenditure each year, with the aim of developing lasting community assets that will create jobs and provide economic growth. These assets are also essential to delivering core government services such as health and education.
Economic activity in construction-related industries increases when new and upgraded infrastructure (such as new hospitals and schools) is built. Infrastructure can also help increase broader economic activity by, for example, improving:
- transport links such as road, rail, and ports, which provide access to water for new agricultural activities
- digital connectivity for businesses in regional and rural areas.
Each year, in the Queensland Government’s budget, the capital statement (Budget Paper 3) provides information to Queenslanders on major capital projects across the state. This includes the regional location, listed by Australian Bureau of Statistics statistical areas (for example, statistical area level 4 (SA4)). Queensland Treasury maintains a website that allows the public to filter for their SA4 region and see what capital projects are planned in their area and the current year budget.
In the 4 financial years from 2019–20 to 2022–23, an average of 38 per cent of state capital spending was focused on regional Queensland. In 2023–24, this shifted significantly to 46 per cent. This shift has been driven primarily by the Queensland Government’s Queensland Energy and Jobs Plan and the Big Build capital program, which aim to deliver infrastructure to a variety of areas within regional Queensland, including central and outback areas.
In Major projects 2023 (Report 7: 2023–24), we provide further insights into significant infrastructure projects in Queensland, including capital expenditure across Queensland’s regions and completion of regional infrastructure plans.
Are government entities encouraged to buy from local suppliers?
The Queensland Government has a 'buy Queensland’ approach to procurement. As part of this, agencies are required to apply a local benefits approach when purchasing goods and services.
Under the Queensland Procurement Policy 2023, at least one ‘local supplier’ should be invited to respond for routine procurement (low-value and low-risk activities, such as catering). This is a supplier who maintains a workforce that lives within 125 kilometres of where the goods or services are to be supplied. If a capable local supplier does not exist within the 125-kilometre radius, the radius should be extended progressively to the local region, then Queensland, then outside of Queensland, until a suitable supplier is identified.
If a procurement is ‘significant’, either because of high expenditure and/or high business risk, an entity should apply a ‘local benefits test’, where a weighting of 10 to 30 per cent may be applied to local suppliers. The origin of a supplier is not relevant; what is important is the benefit that a supplier can bring locally. A local benefits test is a tool for evaluating the benefit a supplier would bring to the local area in Queensland. This could include using a local workforce or local businesses as part of the supply chain.
The Queensland Government publishes an annual procurement statement. In its 2023 statement, it reported that, between 1 September 2017 and 30 June 2023:
- $64.8 billion had been spent with Queensland suppliers.
- $12.5 billion had been spent with regional Queensland suppliers.
- Of the total procurement spend, 35 per cent of all suppliers had registered addresses in regional Queensland.
However, the statement does not include the proportion of all Queensland Government procurement that occurred with a local supplier (that is, those within 125 kilometres of where the goods or services are to be supplied).
Individual entities report the value of contracts awarded over $10,000 on the government’s Open Data website. Again, this data does not indicate whether the contract was awarded to a local supplier. It does include the weighting applied towards the local benefits test for contracts over $10 million, but not for those below $10 million. This could make it difficult for Queenslanders to know how much is being spent with local suppliers.
3. Helping the regions grow
In this chapter, we discuss how the Queensland Government is delivering on its stated objective to help Queensland’s regions grow. This includes:
- which government entities have responsibility for economic development in the regions
- how entities set regional boundaries and work together to deliver services
- how the government is planning for the regions.
The Queensland Government periodically publishes a statement of its broad objectives for the community and tables it in the parliament. The statement reflects the government’s vision for Queensland and outlines its plan for building future prosperity and growth across the state. It has 12 community objectives spread across the categories of good jobs, better services, and great lifestyle.
Many of the community objectives offer benefits to the regions, such as supporting employment, small business, manufacturing, and infrastructure. There is also one objective specifically for Queensland’s regions: ‘Growing our regions: Help Queensland’s regions grow by attracting people, talent, and investment, and driving sustainable economic prosperity’.
Who is responsible for growing Queensland’s regions?
Responsibility for Queensland’s regions is shared across government. Most entities have a role, which may include delivering essential services, supporting jobs, or growing regional industries. For example, the Queensland Government’s Queensland Energy and Jobs Plan intends to unlock opportunities for industry and investment across the state. We discuss this in Energy 2023 (Report 5: 2023–24).
In this report, we focus on 4 departments with responsibility for functions that directly target regional growth, as outlined in Figure 3A.
Function | Department | Description |
|---|---|---|
| Regional statutory planning | Department of Housing, Local Government, Planning and Public Works | Regional statutory planning produces long-term strategic documents that guide land use planning for state and local governments. |
| Regional economic development | Department of Regional Development, Manufacturing and Water | Regional economic development drives investment and employment by delivering various strategy and policy initiatives including facilitating regional economic development opportunities, water infrastructure, and support to the state’s manufacturing industry. |
| Rural economic development | Department of Agriculture and Fisheries | Rural economic development services areas in rural Queensland to expand productive, sustainable, and resilient food and fibre exports to domestic and international markets; support and develop Queensland’s agriculture and aquaculture industry; and mitigate disruptions to supply chains and the impacts on regions due to biosecurity and climate risk. |
| Economic development | Department of State Development and Infrastructure | Economic development in Queensland attracts and facilitates investment opportunities to provide enduring economic benefits for Queenslanders, including economic growth, stimulated enterprise development, and job creation opportunities. |
Note: This list includes functions that are specifically targeted at developing and growing regions. It does not represent all government functions that contribute to regions and their economies.
Compiled by the Queensland Audit Office from Queensland Government information.
How frequently have regional growth functions moved between departments?
Machinery of government changes often involve the restructure of functions across government departments. These changes can occur at any time, although they commonly take place after an election to align services with the government’s objectives and facilitate changes to ministers’ portfolios.
The departments with functions for growing the regions have experienced multiple machinery of government changes since 2015. For example, the regional statutory planning function has belonged to 5 different government departments since then.
There have also been periods where these functions have been co-located in the same department. For example, for a period between 2017 and 2020, one department housed the regional statutory planning, regional economic development, and economic development functions.
Figure 3B provides an overview of the relevant machinery of government changes impacting the 4 functions we discuss in this chapter.
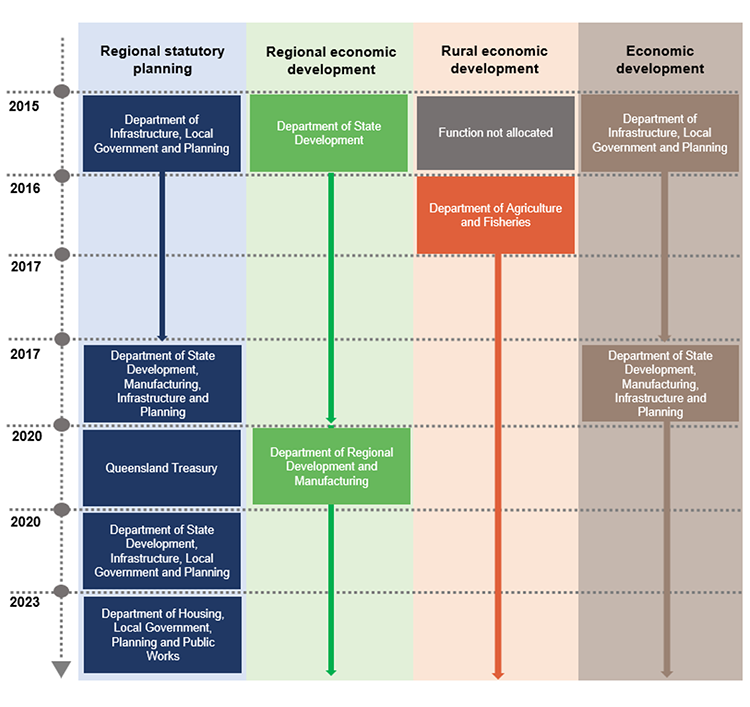
Notes: This figure outlines when functions moved between departments, but it does not capture all machinery of government changes. For example, it does not include when a department changes its name or gains or loses other functions. Some years have seen multiple machinery of government changes. Department names in this figure reflect the title of the department at the time of the machinery of government change. Current department names are outlined in Figure 3A.
Compiled by the Queensland Audit Office from Queensland Government information.
The government of the day has the right to decide how best to organise the functions it governs, but machinery of government changes can present risks. For example:
- Changes in senior leadership can affect strategic initiatives and the delivery of projects.
- Having different cultures within individual functions can prevent a department from working cohesively to achieve the same strategic objectives.
- The existing people, systems, and processes may not meet the needs of a new department.
- The transfer of information between systems and networks may be slow or inaccurate.
We discuss these risks in more detail in Implementing machinery of government changes (Report 17: 2022–23).
Many departments have objectives to grow the regions
Each government department must publish a strategic plan that outlines how it will contribute to the government’s community objectives. Almost all departments have at least one strategic objective linked to the government’s ‘growing our regions’ objective in their strategic plan. Figure 3C presents an example of these objectives from a selection of departments (excluding the 4 departments in Figure 3A).
| Department | Objective |
|---|---|
| Queensland Health | Develop and implement workforce mobility initiatives that support rural and remote employment and professional development. |
| Department of Youth Justice, Employment, Small Business and Training | Growing our regions – by providing funding to regional non-government service providers and working with local governments to welcome and attract people, talent, investment and economic prosperity to regions and by supporting and growing regional partnerships and working with regional business and industry on projects and programs to support economic resilience and growth. |
| Department of Tourism, Innovation and Sport | Increase regional economic diversification by building innovation networks, improving business readiness and supporting collaboration efforts across Queensland’s regions. |
Note: The department names listed above align with the department’s name in each strategic plan. The Department of Youth Justice, Employment, Small Business and Training; and the Department of Tourism, Innovation and Sport were both renamed following machinery of government changes in December 2023.
Queensland Audit Office – taken directly from the departments’ strategic plans.
How do entities deliver services across regions?
Helping Queensland’s regions to grow requires coordination and management across government. For example, a transport infrastructure opportunity may require collaboration across multiple government entities in several regions. Economic development functions are also split across 3 departments. Achieving their objectives can be challenging if entities do not have effective arrangements for working together.
What regional boundaries do entities use?
Many Queensland Government entities establish their own regional boundaries for planning or service delivery purposes. This might be to organise the location of their staff and physical facilities, such as police stations or hospitals. These boundaries vary across different entities. Some individual entities also use multiple regional boundaries to deliver their different services.
Figure 3D provides an example of how some government entities structure their regions.
| Entity | Regional structure |
|---|---|
| Department of Agriculture and Fisheries | 3 regions |
| Department of Child Safety, Seniors and Disability Services | 6 regions |
| Department of Education | 8 regions |
| Queensland Fire and Emergency Services | 7 regions |
| Queensland Health | 16 hospital and health service regions |
| Department of Housing, Local Government, Planning and Public Works | 4 housing regions 13 regional planning areas 77 local government areas |
| Queensland Police Service | 15 police districts in 7 regions |
| Department of Regional Development, Manufacturing and Water | 10 regional development regions |
| Department of State Development and Infrastructure | 11 regional offices |
| Department of Transport and Main Roads | 12 districts in 6 regions |
Compiled by the Queensland Audit Office from information published by Queensland Government departments.
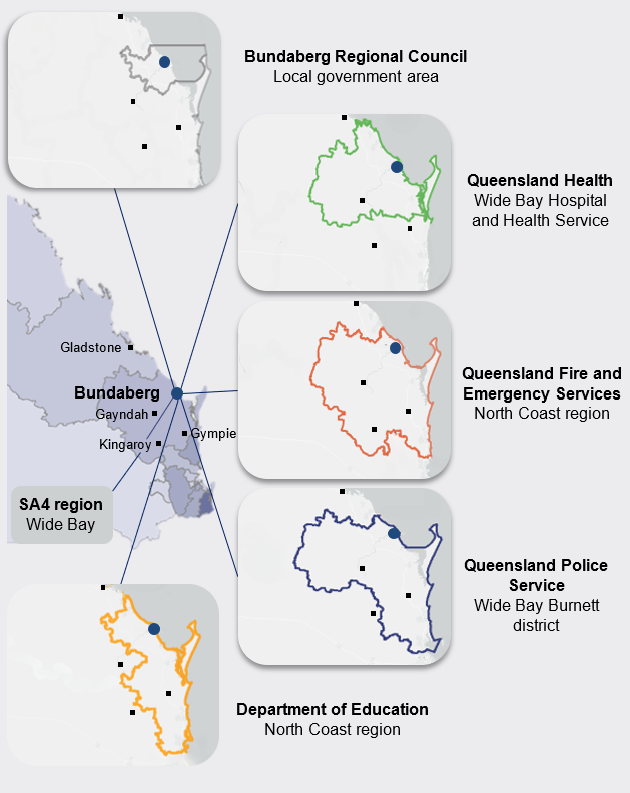
While regional boundaries tend to combine multiple local government areas, each department uses a different approach to group multiple local government areas into a single ‘region’. In some cases, departments split local government areas across different regions.
On the ground, this means one town or city can belong to many different regions, depending on the government entity. This can present an additional complication for entities when cooperating to plan and deliver services to the regions. For example, it can be challenging to identify the correct representatives from each department when coordinating across regions.
Figure 3E provides an example, showing the differing regional boundaries that include the city of Bundaberg, as used by a selection of entities.
| Case study 2 |
|---|
|
Note: Boundary lines and locations are approximate.
Compiled by the Queensland Audit Office using information from the Queensland Government Open Data website.
Regional boundaries are flexible during disasters
Entities have demonstrated that they can coordinate regional activities efficiently when necessary, despite the different boundaries. Disaster management is an example. Queensland’s disaster management arrangements use a defined governance and leadership model to allow the government to quickly coordinate across the state when needed.
Local governments are primarily responsible for managing disaster events in their area and can activate local disaster management groups as required. These groups can sometimes manage small and contained events without assistance.
If needed, the state can activate one or more of the 22 district disaster management groups. Each district group provides coordinated state government support when required and requested by local governments. Two or more adjoining districts can be temporarily merged to respond to a disaster event if needed.
At the state level, the Queensland Disaster Management Committee provides strategic policy and direction to coordinate disaster planning, disaster mitigation, response, and recovery. Figure 3F highlights disaster management arrangements and how entities coordinate across boundaries in these circumstances.
| Case study 3 |
|---|
South East Queensland experienced a significant flooding event in February and March of 2022. Rivers across the region reached major flood levels, including in the Brisbane, Mary, Bremer, Logan, and Albert River catchments. The flooding event affected 23 local government areas, covering 11 district disaster management groups across the state. Local disaster management groups were activated. They worked closely with district- and state-level disaster management groups. This brought together representatives from key entities to facilitate coordination across existing boundaries. For example, Queensland Health worked collaboratively with the Brisbane district disaster management group and the relevant hospital and health services to meet healthcare needs at evacuation centres across the region. The Department of Environment and Science also worked in partnership with district disaster management groups and Maritime Safety Queensland, within the Department of Transport and Main Roads, to manage the debris removal and initial clean‑up of Queensland waterways following the event. |
Compiled by the Queensland Audit Office from Inspector-General of Emergency Management Report 1: 2022–2023, South East Queensland Rainfall and Flooding February to March 2022 Review.
How does government plan for the regions?
The Queensland Government has policies that guide land use for future developments across the state. For example, the State Planning Policy identifies key matters of state and regional interest, including:
- liveable communities and housing
- economic growth
- environment and heritage.
The government must prepare statutory regional plans under the Planning Act 2016. Following machinery of government changes in December 2023, the Department of Housing, Local Government, Planning and Public Works became responsible for this.
Statutory regional plans are long-term strategic documents that guide land use planning for state and local governments. They also indicate and set direction on how regions will grow and respond to change over time. The purpose of these plans is to:
- set state policy frameworks to deliver defined outcomes in each region
- guide local government land use decisions (reflected in local planning schemes)
- guide investment for governments and industry
- prioritise key infrastructure
- help manage conflicts and priorities between land uses.
The 13 planning regions and the status of their plans are outlined in Appendix D. These regions have evolved over time, with influence from local governments. For example, a local government may ask to move to an adjoining planning region to better reflect its local industries or environment. As a result, the state planning regions differ from the other regional boundaries discussed in this report.
Regional plans are being reviewed and updated
The Queensland Government has committed to reviewing all statutory regional plans that are more than 5 years old – which is 10 of the 13. The review process intends to adopt a coordinated approach to aligning economic drivers, infrastructure priorities, and land use planning.
The government has published 2 updated statutory regional plans since beginning the review process in late 2022. It has committed to working with local governments, First Nations peoples, the community, and key industry groups to consider a balance of interests through these reviews.
How are entities looking for better ways to work together?
Interagency coordination and information sharing is critical for the effective delivery of public services, particularly when it relies on multiple entities. It reduces duplication and enables better, more efficient services.
Government departments are looking at ways to coordinate regional growth activities, both within their own departments, and across the Queensland Government. This includes better coordinating their efforts across economic development, infrastructure, and land use planning.
For example, a new regional collaborative governance model is being implemented in 2024, administered by the Department of Regional Development, Manufacturing and Water. The model has 3 main goals: understanding regional challenges, promoting collaboration between agencies, and cultivating regional leadership. The model is intended to address the challenge of collaboration between different government agencies on regional issues. By providing additional resourcing to existing collaboration mechanisms, it aims to provide a new way for agencies to work together.
To be effective, interagency coordination requires empowered leadership and clear roles and responsibilities. It is vital that coordination efforts effectively integrate programs and processes, establish clear performance measures and targets, and share relevant information and data.
Agencies often find these areas challenging to implement effectively. We frequently make recommendations that are designed to improve governance, coordination and information sharing, and performance monitoring and reporting. We captured this in our report 2023 status of Auditor-General’s recommendations (Report 3: 2023–24) and on our Status of Auditor-General's recommendations dashboard, available at www.qao.qld.gov.au/status-auditor-generals-recommendations-dashboard.
The success of any regional governance model will depend on how effectively agencies can overcome differing regional boundaries, dispersed government functions, and the coordination challenges of delivering services across Queensland’s diverse regions.